Box Plots and Data Analysis Concepts
Interactive Video
•
Mathematics
•
9th - 10th Grade
•
Practice Problem
•
Hard

Thomas White
FREE Resource
Read more
28 questions
Show all answers
1.
MULTIPLE CHOICE QUESTION
30 sec • 1 pt
What is the purpose of a box plot?
To calculate the mean of a dataset
To show the frequency of data points
To compare two datasets
To display the distribution of data based on a five-number summary
2.
MULTIPLE CHOICE QUESTION
30 sec • 1 pt
Which of the following is NOT part of the five-number summary?
Median
Mean
Minimum
Maximum
3.
MULTIPLE CHOICE QUESTION
30 sec • 1 pt
In a box plot, what does the line inside the box represent?
The median
The mode
The range
The mean
4.
MULTIPLE CHOICE QUESTION
30 sec • 1 pt
What is a stem-and-leaf plot used for?
To calculate the average of a dataset
To compare two datasets
To organize data and show its shape
To display data in a histogram format
5.
MULTIPLE CHOICE QUESTION
30 sec • 1 pt
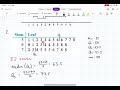
How many scores are there in the given stem-and-leaf plot example?
40
32
25
20
6.
MULTIPLE CHOICE QUESTION
30 sec • 1 pt
How is the median calculated from a list of scores?
By identifying the middle score or the average of two middle scores
By finding the average of all scores
By finding the most frequent score
By subtracting the smallest score from the largest score
7.
MULTIPLE CHOICE QUESTION
30 sec • 1 pt
What is the lower quartile (Q1) in the given example?
56
51
73.5
63.5
Access all questions and much more by creating a free account
Create resources
Host any resource
Get auto-graded reports
Continue with Google

Continue with Email
Continue with Classlink
Continue with Clever
or continue with
Microsoft
%20(1).png)
Apple
Others
Already have an account?
Popular Resources on Wayground

7 questions
History of Valentine's Day
Interactive video
•
4th Grade
15 questions
Fractions on a Number Line
Quiz
•
3rd Grade
20 questions
Equivalent Fractions
Quiz
•
3rd Grade
25 questions
Multiplication Facts
Quiz
•
5th Grade
22 questions
fractions
Quiz
•
3rd Grade
15 questions
Valentine's Day Trivia
Quiz
•
3rd Grade
20 questions
Main Idea and Details
Quiz
•
5th Grade
20 questions
Context Clues
Quiz
•
6th Grade
Discover more resources for Mathematics
20 questions
Graphing Inequalities on a Number Line
Quiz
•
6th - 9th Grade
20 questions
Exponent Properties
Quiz
•
9th Grade
15 questions
Combine Like Terms and Distributive Property
Quiz
•
8th - 9th Grade
20 questions
Function or Not a Function
Quiz
•
8th - 9th Grade
10 questions
Factor Quadratic Expressions with Various Coefficients
Quiz
•
9th - 12th Grade
10 questions
Elijah McCoy: Innovations and Impact in Black History
Interactive video
•
6th - 10th Grade
21 questions
Factoring Trinomials (a=1)
Quiz
•
9th Grade
5 questions
Triangle Congruence Theorems
Interactive video
•
9th - 12th Grade