Graphing and Interpreting Data
Interactive Video
•
Mathematics
•
6th - 7th Grade
•
Practice Problem
•
Hard

Thomas White
FREE Resource
Read more
39 questions
Show all answers
1.
MULTIPLE CHOICE QUESTION
30 sec • 1 pt
What is the first step in graphing an ordered pair?
Move up and down according to the Y value
Move left and right according to the X value
Draw a line through the origin
Label the axes
2.
MULTIPLE CHOICE QUESTION
30 sec • 1 pt
In the ordered pair (-1, -2), what does the -1 represent?
The Y-coordinate
The slope of the line
The distance from the origin
The X-coordinate
3.
MULTIPLE CHOICE QUESTION
30 sec • 1 pt
What is the origin in a graph?
The highest point on the graph
The point where the graph ends
The midpoint of the graph
The point where the X and Y axes intersect
4.
MULTIPLE CHOICE QUESTION
30 sec • 1 pt
How do you determine the unit rate from a ratio?
By subtracting the second number from the first
By multiplying the two numbers in the ratio
By dividing the first number by the second
By adding the two numbers in the ratio
5.
MULTIPLE CHOICE QUESTION
30 sec • 1 pt
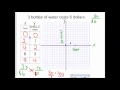
If 3 bottles of water cost $6, how much does 1 bottle cost?
$1
$2
$3
$4
6.
MULTIPLE CHOICE QUESTION
30 sec • 1 pt
What does a straight line through the origin on a graph of a ratio indicate?
The ratio is increasing
The ratio is constant
The ratio is undefined
The ratio is decreasing
7.
MULTIPLE CHOICE QUESTION
30 sec • 1 pt
In the water bottle graph, what does the X-axis represent?
Volume in liters
Time in minutes
Cost in dollars
Number of bottles
Access all questions and much more by creating a free account
Create resources
Host any resource
Get auto-graded reports
Continue with Google

Continue with Email
Continue with Classlink
Continue with Clever
or continue with
Microsoft
%20(1).png)
Apple
Others
Already have an account?
Popular Resources on Wayground

15 questions
Fractions on a Number Line
Quiz
•
3rd Grade
20 questions
Equivalent Fractions
Quiz
•
3rd Grade
25 questions
Multiplication Facts
Quiz
•
5th Grade
54 questions
Analyzing Line Graphs & Tables
Quiz
•
4th Grade
22 questions
fractions
Quiz
•
3rd Grade
20 questions
Main Idea and Details
Quiz
•
5th Grade
20 questions
Context Clues
Quiz
•
6th Grade
15 questions
Equivalent Fractions
Quiz
•
4th Grade
Discover more resources for Mathematics
22 questions
distributive property
Quiz
•
7th Grade
18 questions
Angle Relationships
Quiz
•
7th Grade
15 questions
Distributive Property & Review
Quiz
•
6th Grade
20 questions
Writing Algebraic Expressions
Quiz
•
6th Grade
20 questions
How Some Friendships Last — and Others Don’t Video Questions
Quiz
•
7th Grade
20 questions
Ratios/Rates and Unit Rates
Quiz
•
6th Grade
18 questions
Handbook Refresher Quiz
Quiz
•
7th Grade
20 questions
Graphing Inequalities on a Number Line
Quiz
•
6th - 9th Grade