
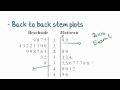
Understanding Back-to-Back Stem Plots
Interactive Video
•
Mathematics
•
9th - 10th Grade
•
Practice Problem
•
Hard
Thomas White
FREE Resource
Read more
27 questions
Show all answers
1.
MULTIPLE CHOICE QUESTION
30 sec • 1 pt
What is a back-to-back stem plot primarily used for?
Displaying categorical data
Analyzing qualitative data
Comparing numerical data across two categories
Showing trends over time
2.
MULTIPLE CHOICE QUESTION
30 sec • 1 pt
In a back-to-back stem plot, where are the leaves located?
On both sides of the stem
Only on the left side of the stem
Above the stem
Only on the right side of the stem
3.
MULTIPLE CHOICE QUESTION
30 sec • 1 pt
Which of the following is NOT a question related to back-to-back stem plots?
Finding the range
Describing the shape
Whether the data is categorical or numerical
Calculating the mean
4.
MULTIPLE CHOICE QUESTION
30 sec • 1 pt
What is the main feature of a back-to-back stem plot?
It has leaves on both sides of the stem
It has a single set of stems
It is only for categorical data
It is used for time series data
5.
MULTIPLE CHOICE QUESTION
30 sec • 1 pt
What is the role of the central stem in a back-to-back stem plot?
It separates the two sets of data
It is used to calculate the mean
It is used for labeling
It represents the highest value
6.
MULTIPLE CHOICE QUESTION
30 sec • 1 pt
When comparing heights of males and females, which plot would be suitable?
Pie chart
Line graph
Back-to-back stem plot
Box plot
7.
MULTIPLE CHOICE QUESTION
30 sec • 1 pt
Why are back-to-back stem plots useful?
They are easy to draw
They simplify complex data
They allow comparison between two groups
They are visually appealing
Access all questions and much more by creating a free account
Create resources
Host any resource
Get auto-graded reports

Continue with Google

Continue with Email

Continue with Classlink

Continue with Clever
or continue with

Microsoft
%20(1).png)
Apple
Others
Already have an account?
Similar Resources on Wayground
11 questions
Concept 3 - Scale, Proportion, and Quantity
Interactive video
•
9th - 10th Grade
11 questions
Understanding Frequency and Data Analysis
Interactive video
•
9th - 10th Grade
11 questions
Understanding Algebra and Geometry Concepts
Interactive video
•
9th - 10th Grade
11 questions
Graphing Techniques and Data Representation
Interactive video
•
9th - 10th Grade
11 questions
A Beginner's Guide to Graphing Data
Interactive video
•
9th - 10th Grade
11 questions
Excel Data Analysis Techniques
Interactive video
•
9th - 10th Grade
11 questions
English Essentials - Powering Through Prose - 'Big Picture' Questions in Prose Fiction Analysis (Stage 4, Years/Grades 7
Interactive video
•
9th - 10th Grade
11 questions
Probability Statistics - The Foundations of Machine Learning - Exploring Data Types in Code
Interactive video
•
9th - 10th Grade
Popular Resources on Wayground
15 questions
Fractions on a Number Line
Quiz
•
3rd Grade
20 questions
Equivalent Fractions
Quiz
•
3rd Grade
25 questions
Multiplication Facts
Quiz
•
5th Grade
54 questions
Analyzing Line Graphs & Tables
Quiz
•
4th Grade
22 questions
fractions
Quiz
•
3rd Grade
20 questions
Main Idea and Details
Quiz
•
5th Grade
20 questions
Context Clues
Quiz
•
6th Grade
15 questions
Equivalent Fractions
Quiz
•
4th Grade
Discover more resources for Mathematics
20 questions
Graphing Inequalities on a Number Line
Quiz
•
6th - 9th Grade
18 questions
SAT Prep: Ratios, Proportions, & Percents
Quiz
•
9th - 10th Grade
12 questions
Exponential Growth and Decay
Quiz
•
9th Grade
12 questions
Parallel Lines Cut by a Transversal
Quiz
•
10th Grade
12 questions
Add and Subtract Polynomials
Quiz
•
9th - 12th Grade
15 questions
Combine Like Terms and Distributive Property
Quiz
•
8th - 9th Grade
20 questions
Function or Not a Function
Quiz
•
8th - 9th Grade
10 questions
Elijah McCoy: Innovations and Impact in Black History
Interactive video
•
6th - 10th Grade