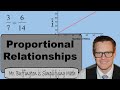
Proportional Relationships and Their Characteristics
Interactive Video
•
Mathematics
•
6th - 8th Grade
•
Practice Problem
•
Hard

Thomas White
FREE Resource
Read more
8 questions
Show all answers
1.
MULTIPLE CHOICE QUESTION
30 sec • 1 pt
What is a key characteristic of proportional relationships?
They cannot be represented graphically.
They have a constant rate of change.
They have varying rates of change.
They are always decreasing.
2.
MULTIPLE CHOICE QUESTION
30 sec • 1 pt
How can proportional relationships be expressed?
Only through equations.
Using equivalent ratios.
Only through graphs.
Only through tables.
3.
MULTIPLE CHOICE QUESTION
30 sec • 1 pt
Which of the following is an example of a proportional ratio?
6 to 12 and 8 to 16
6 to 12 and 7 to 14
6 to 12 and 5 to 10
6 to 12 and 3 to 6
4.
MULTIPLE CHOICE QUESTION
30 sec • 1 pt
What does the slope represent in a proportional relationship?
The maximum value of a variable.
The minimum value of a variable.
The total distance covered.
The rate of change between two variables.
5.
MULTIPLE CHOICE QUESTION
30 sec • 1 pt
In the equation y = 2x, what does the number 2 represent?
The slope of the line.
The y-intercept.
The total distance.
The x-intercept.
6.
MULTIPLE CHOICE QUESTION
30 sec • 1 pt
What is a characteristic of a graph representing a proportional relationship?
It is a straight line.
It is a curved line.
It is a horizontal line.
It has multiple peaks.
7.
MULTIPLE CHOICE QUESTION
30 sec • 1 pt
Which towing company has a greater slope in the comparison?
Both have the same slope
Blue Towing Company
Neither has a slope
Red Towing Company
Access all questions and much more by creating a free account
Create resources
Host any resource
Get auto-graded reports
Continue with Google

Continue with Email
Continue with Classlink
Continue with Clever
or continue with
Microsoft
%20(1).png)
Apple
Others
Already have an account?
