Stem and Leaf Diagram Concepts
Interactive Video
•
Mathematics
•
9th - 10th Grade
•
Practice Problem
•
Hard

Thomas White
FREE Resource
Read more
15 questions
Show all answers
1.
MULTIPLE CHOICE QUESTION
30 sec • 1 pt
What is the primary purpose of a stem and leaf diagram?
To display data in a pie chart format
To compare two different data sets
To calculate the probability of events
To organize data for easy interpretation
2.
MULTIPLE CHOICE QUESTION
30 sec • 1 pt
In a stem and leaf diagram, what does the 'stem' represent?
The decimal place of the numbers
The units place of the numbers
The tens place of the numbers
The hundreds place of the numbers
3.
MULTIPLE CHOICE QUESTION
30 sec • 1 pt
What is the significance of the 'leaf' in a stem and leaf diagram?
It represents the tens place of the numbers
It represents the units place of the numbers
It represents the hundreds place of the numbers
It represents the decimal place of the numbers
4.
MULTIPLE CHOICE QUESTION
30 sec • 1 pt
How is the mode determined from a stem and leaf diagram?
By finding the average of all numbers
By identifying the number that appears most frequently
By finding the middle number in the data set
By calculating the difference between the highest and lowest numbers
5.
MULTIPLE CHOICE QUESTION
30 sec • 1 pt
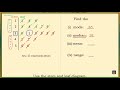
Which number is the mode in the given stem and leaf diagram?
35
31
24
50
6.
MULTIPLE CHOICE QUESTION
30 sec • 1 pt
What is the median in a data set?
The average of all numbers
The number that appears most frequently
The difference between the highest and lowest numbers
The middle number when data is ordered
7.
MULTIPLE CHOICE QUESTION
30 sec • 1 pt
How many numbers are there before and after the median in the given data set?
8 before and 8 after
9 before and 9 after
10 before and 10 after
11 before and 11 after
Access all questions and much more by creating a free account
Create resources
Host any resource
Get auto-graded reports
Continue with Google

Continue with Email
Continue with Classlink
Continue with Clever
or continue with
Microsoft
%20(1).png)
Apple
Others
Already have an account?
