Data Comparison and Analysis
Interactive Video
•
Mathematics
•
2nd - 3rd Grade
•
Practice Problem
•
Hard

Thomas White
FREE Resource
Read more
28 questions
Show all answers
1.
MULTIPLE CHOICE QUESTION
30 sec • 1 pt
What is the main focus of the video tutorial?
Learning about multiplication
Comparing data using charts and graphs
Understanding geometry
Exploring algebraic expressions
2.
MULTIPLE CHOICE QUESTION
30 sec • 1 pt
What mathematical operations are used to compare data in the video?
Multiplication and division
Exponentiation and roots
Integration and differentiation
Addition and subtraction
3.
MULTIPLE CHOICE QUESTION
30 sec • 1 pt
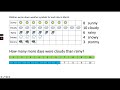
How many sunny days were recorded in March?
5
8
10
12
4.
MULTIPLE CHOICE QUESTION
30 sec • 1 pt
How many cloudy days were recorded in March?
6
8
10
12
5.
MULTIPLE CHOICE QUESTION
30 sec • 1 pt
What is the total number of stormy days in March?
5
2
4
3
6.
MULTIPLE CHOICE QUESTION
30 sec • 1 pt
What is the total number of rainy and snowy days in March?
12
14
8
10
7.
MULTIPLE CHOICE QUESTION
30 sec • 1 pt
How many days were both rainy and snowy?
6
12
8
10
Access all questions and much more by creating a free account
Create resources
Host any resource
Get auto-graded reports
Continue with Google

Continue with Email
Continue with Classlink
Continue with Clever
or continue with
Microsoft
%20(1).png)
Apple
Others
Already have an account?
Similar Resources on Wayground
Popular Resources on Wayground

15 questions
Fractions on a Number Line
Quiz
•
3rd Grade
20 questions
Equivalent Fractions
Quiz
•
3rd Grade
25 questions
Multiplication Facts
Quiz
•
5th Grade
22 questions
fractions
Quiz
•
3rd Grade
20 questions
Main Idea and Details
Quiz
•
5th Grade
20 questions
Context Clues
Quiz
•
6th Grade
15 questions
Equivalent Fractions
Quiz
•
4th Grade
20 questions
Figurative Language Review
Quiz
•
6th Grade
Discover more resources for Mathematics
15 questions
Fractions on a Number Line
Quiz
•
3rd Grade
20 questions
Equivalent Fractions
Quiz
•
3rd Grade
22 questions
fractions
Quiz
•
3rd Grade
10 questions
Area
Quiz
•
3rd Grade
20 questions
Identifying Fractions
Quiz
•
3rd Grade
100 questions
100 multiplication facts
Quiz
•
3rd Grade
10 questions
multiplication facts
Quiz
•
3rd Grade
20 questions
multiplication and division facts
Quiz
•
3rd Grade