Data Displays and Analysis Concepts
Interactive Video
•
Mathematics
•
6th - 7th Grade
•
Practice Problem
•
Hard

Thomas White
FREE Resource
Read more
11 questions
Show all answers
1.
MULTIPLE CHOICE QUESTION
30 sec • 1 pt
What is the main focus of Topic 11 in the statistics unit?
Analyzing Data Displays
Algebraic Expressions
Probability and Random Variables
Calculus and Integration
2.
MULTIPLE CHOICE QUESTION
30 sec • 1 pt
Which data displays are introduced in the overview of Topic 11?
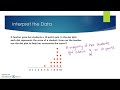
Dot Plots, Histograms, and Box Plots
Pie Charts, Line Graphs, and Bar Charts
Bar Charts, Histograms, and Line Graphs
Scatter Plots, Line Graphs, and Pie Charts
3.
MULTIPLE CHOICE QUESTION
30 sec • 1 pt
What is the first step in creating a dot plot?
Calculate the mean
Draw the bars
List all data points
Determine the range of values
4.
MULTIPLE CHOICE QUESTION
30 sec • 1 pt
In the car fuel efficiency example, what is the fuel efficiency of the car Manuel wants to buy?
30 miles per gallon
26 miles per gallon
22 miles per gallon
28 miles per gallon
5.
MULTIPLE CHOICE QUESTION
30 sec • 1 pt
What is an outlier in a data set?
A data point that is the mode of the set
A data point that is outside most of the other data
A data point that is the average of the set
A data point that is the median of the set
6.
MULTIPLE CHOICE QUESTION
30 sec • 1 pt
In the student quiz scores example, how many students scored 9 points?
Four students
Six students
Five students
Seven students
7.
MULTIPLE CHOICE QUESTION
30 sec • 1 pt
What is the purpose of a frequency table in creating a histogram?
To organize data into intervals
To determine the mean
To calculate the median
To list all data points
Access all questions and much more by creating a free account
Create resources
Host any resource
Get auto-graded reports
Continue with Google

Continue with Email
Continue with Classlink
Continue with Clever
or continue with
Microsoft
%20(1).png)
Apple
Others
Already have an account?
Popular Resources on Wayground

15 questions
Fractions on a Number Line
Quiz
•
3rd Grade
20 questions
Equivalent Fractions
Quiz
•
3rd Grade
25 questions
Multiplication Facts
Quiz
•
5th Grade
54 questions
Analyzing Line Graphs & Tables
Quiz
•
4th Grade
22 questions
fractions
Quiz
•
3rd Grade
20 questions
Main Idea and Details
Quiz
•
5th Grade
20 questions
Context Clues
Quiz
•
6th Grade
15 questions
Equivalent Fractions
Quiz
•
4th Grade
Discover more resources for Mathematics
22 questions
distributive property
Quiz
•
7th Grade
18 questions
Angle Relationships
Quiz
•
7th Grade
15 questions
Distributive Property & Review
Quiz
•
6th Grade
20 questions
Writing Algebraic Expressions
Quiz
•
6th Grade
20 questions
How Some Friendships Last — and Others Don’t Video Questions
Quiz
•
7th Grade
20 questions
Ratios/Rates and Unit Rates
Quiz
•
6th Grade
18 questions
Handbook Refresher Quiz
Quiz
•
7th Grade
20 questions
Graphing Inequalities on a Number Line
Quiz
•
6th - 9th Grade