Customer Percentage Analysis and Graph Interpretation
Interactive Video
•
Mathematics
•
6th - 7th Grade
•
Practice Problem
•
Medium

Thomas White
Used 1+ times
FREE Resource
Read more
31 questions
Show all answers
1.
MULTIPLE CHOICE QUESTION
30 sec • 1 pt
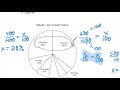
What type of data representation is used to show ice cream sales at the Yummy Ice Cream Parlor?
Line graph
Pie chart
Histogram
Bar graph
2.
MULTIPLE CHOICE QUESTION
30 sec • 1 pt
How many customers visited the ice cream parlor on Sunday according to the table?
600
500
700
400
3.
MULTIPLE CHOICE QUESTION
30 sec • 1 pt
What is the total number of customers for the week?
1400
1200
1300
1500
4.
MULTIPLE CHOICE QUESTION
30 sec • 1 pt
What percentage of the total weekly customers visited on Sunday?
40%
35%
30%
36%
5.
MULTIPLE CHOICE QUESTION
30 sec • 1 pt
What method can be used to calculate the percentage of customers on a specific day?
Cross products
Multiplication
Addition
Subtraction
6.
MULTIPLE CHOICE QUESTION
30 sec • 1 pt
How do you calculate the percentage of customers for a specific day?
Divide the number of customers by the total
Multiply the number of customers by 100
Subtract the number of customers from the total
Add the number of customers to the total
7.
MULTIPLE CHOICE QUESTION
30 sec • 1 pt
What is the percentage of customers on Sunday according to the circle graph?
40%
30%
35%
36%
Access all questions and much more by creating a free account
Create resources
Host any resource
Get auto-graded reports
Continue with Google

Continue with Email
Continue with Classlink
Continue with Clever
or continue with
Microsoft
%20(1).png)
Apple
Others
Already have an account?
Popular Resources on Wayground

8 questions
Spartan Way - Classroom Responsible
Quiz
•
9th - 12th Grade
15 questions
Fractions on a Number Line
Quiz
•
3rd Grade
14 questions
Boundaries & Healthy Relationships
Lesson
•
6th - 8th Grade
20 questions
Equivalent Fractions
Quiz
•
3rd Grade
3 questions
Integrity and Your Health
Lesson
•
6th - 8th Grade
25 questions
Multiplication Facts
Quiz
•
5th Grade
9 questions
FOREST Perception
Lesson
•
KG
20 questions
Main Idea and Details
Quiz
•
5th Grade
Discover more resources for Mathematics
12 questions
Review: Surface Area of Rectangular and Triangular Prisms
Quiz
•
6th Grade
36 questions
6th Grade Math STAAR Review
Quiz
•
6th Grade
14 questions
Volume of rectangular prisms
Quiz
•
7th Grade
20 questions
Graphing Inequalities on a Number Line
Quiz
•
6th - 9th Grade
26 questions
Graphing Inequalities on a Number Line
Quiz
•
6th Grade
15 questions
Distributive Property & Review
Quiz
•
6th Grade
20 questions
Math Review
Quiz
•
6th Grade
15 questions
Mean, Median, Mode, and Range
Quiz
•
6th Grade