Evaluating Linear Functions and Graphs
Interactive Video
•
Mathematics
•
6th - 7th Grade
•
Practice Problem
•
Hard

Thomas White
FREE Resource
Read more
36 questions
Show all answers
1.
MULTIPLE CHOICE QUESTION
30 sec • 1 pt
What is the first step in graphing a linear equation?
Drawing a straight line
Calculating the slope
Plotting random points on a graph
Filling out a table of values
2.
MULTIPLE CHOICE QUESTION
30 sec • 1 pt
What is the general form of a linear equation?
y = mx + b
y = ax^2 + bx + c
y = ax^3 + bx^2 + cx + d
y = a/x
3.
MULTIPLE CHOICE QUESTION
30 sec • 1 pt
What do you need to do after filling out a table of values?
Find the y-intercept
Calculate the slope
Draw a parabola
Graph the points
4.
MULTIPLE CHOICE QUESTION
30 sec • 1 pt
Which equation is used in the example to fill out the table of values?
y = 3x + 2
y = 5x + 10
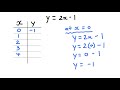
y = 2x - 1
y = x^2 + 1
5.
MULTIPLE CHOICE QUESTION
30 sec • 1 pt
What x-values are chosen for the example?
10, 20, 30, 40, 50
100, 200, 300, 400, 500
0, 1, 2, 3, 4
5, 6, 7, 8, 9
6.
MULTIPLE CHOICE QUESTION
30 sec • 1 pt
What is the y-value when x = 0 for the equation y = 2x - 1?
-1
2
1
0
7.
MULTIPLE CHOICE QUESTION
30 sec • 1 pt
What is the y-value when x = 1 for the equation y = 2x - 1?
0
1
3
2
Access all questions and much more by creating a free account
Create resources
Host any resource
Get auto-graded reports
Continue with Google

Continue with Email
Continue with Classlink
Continue with Clever
or continue with
Microsoft
%20(1).png)
Apple
Others
Already have an account?
Popular Resources on Wayground

15 questions
Fractions on a Number Line
Quiz
•
3rd Grade
20 questions
Equivalent Fractions
Quiz
•
3rd Grade
25 questions
Multiplication Facts
Quiz
•
5th Grade
22 questions
fractions
Quiz
•
3rd Grade
20 questions
Main Idea and Details
Quiz
•
5th Grade
20 questions
Context Clues
Quiz
•
6th Grade
15 questions
Equivalent Fractions
Quiz
•
4th Grade
20 questions
Figurative Language Review
Quiz
•
6th Grade
Discover more resources for Mathematics
20 questions
Exponents
Quiz
•
6th Grade
22 questions
distributive property
Quiz
•
7th Grade
15 questions
Distributive Property & Review
Quiz
•
6th Grade
20 questions
Writing Algebraic Expressions
Quiz
•
6th Grade
20 questions
Ratios/Rates and Unit Rates
Quiz
•
6th Grade
20 questions
Writing and Graphing Inequalities
Quiz
•
6th Grade
10 questions
Unit Rate
Quiz
•
6th Grade
20 questions
Graphing Inequalities on a Number Line
Quiz
•
6th - 9th Grade