Understanding Data Distribution Concepts
Interactive Video
•
Mathematics
•
6th - 7th Grade
•
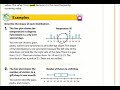
Practice Problem
•
Hard

Thomas White
FREE Resource
Read more
39 questions
Show all answers
1.
MULTIPLE CHOICE QUESTION
30 sec • 1 pt
What is the primary focus of Chapter 12, Lesson 4?
Exploring data visualization techniques
Studying the history of statistics
Understanding the shape of data distributions
Learning about data collection methods
2.
MULTIPLE CHOICE QUESTION
30 sec • 1 pt
Which term describes when both sides of a data distribution are similar?
Cluster
Symmetry
Gap
Peak
3.
MULTIPLE CHOICE QUESTION
30 sec • 1 pt
What does a gap in a data distribution indicate?
A symmetrical distribution
A high frequency of data points
A lack of data values
A central tendency
4.
MULTIPLE CHOICE QUESTION
30 sec • 1 pt
In a data distribution, what is a peak?
The least occurring value
A symmetrical point
A gap in the data
The most frequently occurring value
5.
MULTIPLE CHOICE QUESTION
30 sec • 1 pt
What is a cluster in a data distribution?
A gap in the data
A single data point
Data points grouped closely together
Data points spread out evenly
6.
MULTIPLE CHOICE QUESTION
30 sec • 1 pt
What does a peak in a data distribution represent?
A symmetrical point
A gap in the data
The most frequent value
The least frequent value
7.
MULTIPLE CHOICE QUESTION
30 sec • 1 pt
What is the significance of identifying clusters in data?
To find the mean
To understand data grouping
To calculate the range
To identify gaps
Access all questions and much more by creating a free account
Create resources
Host any resource
Get auto-graded reports
Continue with Google

Continue with Email
Continue with Classlink
Continue with Clever
or continue with
Microsoft
%20(1).png)
Apple
Others
Already have an account?
