Understanding Side-by-Side Column Graphs
Interactive Video
•
Mathematics
•
3rd - 5th Grade
•
Practice Problem
•
Easy

Thomas White
Used 1+ times
FREE Resource
Read more
9 questions
Show all answers
1.
MULTIPLE CHOICE QUESTION
30 sec • 1 pt
What is the primary purpose of a side-by-side column graph?
To illustrate a single data set
To display data in a circular format
To compare two sets of data side by side
To show data trends over time
2.
MULTIPLE CHOICE QUESTION
30 sec • 1 pt
What is an essential feature of a graph that explains its content?
The title
The font style
The grid lines
The color scheme
3.
MULTIPLE CHOICE QUESTION
30 sec • 1 pt
Why is it important to label the y-axis clearly?
To make the graph look colorful
To ensure the data is interpreted correctly
To add more text to the graph
To make the graph appear complex
4.
MULTIPLE CHOICE QUESTION
30 sec • 1 pt
What distinguishes a side-by-side column graph from a normal column graph?
It compares two data sets side by side
It uses more colors
It has a 3D effect
It is always larger in size
5.
MULTIPLE CHOICE QUESTION
30 sec • 1 pt
In the sports preferences example, how many girls liked soccer?
Four
Two
Six
Eight
6.
MULTIPLE CHOICE QUESTION
30 sec • 1 pt
What can you determine from a side-by-side column graph?
The least popular data point
All of the above
The most popular data point
Comparison between two groups
7.
MULTIPLE CHOICE QUESTION
30 sec • 1 pt
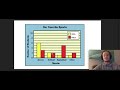
In the holiday preferences example, which holiday was least popular among third graders?
Christmas
Thanksgiving
Easter
Halloween
Access all questions and much more by creating a free account
Create resources
Host any resource
Get auto-graded reports
Continue with Google

Continue with Email
Continue with Classlink
Continue with Clever
or continue with
Microsoft
%20(1).png)
Apple
Others
Already have an account?
Popular Resources on Wayground

7 questions
History of Valentine's Day
Interactive video
•
4th Grade
15 questions
Fractions on a Number Line
Quiz
•
3rd Grade
20 questions
Equivalent Fractions
Quiz
•
3rd Grade
25 questions
Multiplication Facts
Quiz
•
5th Grade
22 questions
fractions
Quiz
•
3rd Grade
15 questions
Valentine's Day Trivia
Quiz
•
3rd Grade
20 questions
Main Idea and Details
Quiz
•
5th Grade
20 questions
Context Clues
Quiz
•
6th Grade
Discover more resources for Mathematics
15 questions
Fractions on a Number Line
Quiz
•
3rd Grade
20 questions
Equivalent Fractions
Quiz
•
3rd Grade
25 questions
Multiplication Facts
Quiz
•
5th Grade
22 questions
fractions
Quiz
•
3rd Grade
15 questions
Equivalent Fractions
Quiz
•
4th Grade
18 questions
Comparing Fractions with same numerator or denominator
Quiz
•
3rd Grade
20 questions
Classifying Triangles
Quiz
•
5th Grade
10 questions
Area
Quiz
•
3rd Grade