Understanding Box and Whisker Plots
Interactive Video
•
Mathematics
•
6th - 8th Grade
•
Practice Problem
•
Hard

Thomas White
FREE Resource
Read more
19 questions
Show all answers
1.
MULTIPLE CHOICE QUESTION
30 sec • 1 pt
What is the primary purpose of a box and whisker plot?
To calculate the standard deviation
To list all data points
To show the distribution of data
To display the mean of a dataset
2.
MULTIPLE CHOICE QUESTION
30 sec • 1 pt
Which of the following is NOT a component of a box and whisker plot?
Mean
Maximum
Quartiles
Minimum
3.
MULTIPLE CHOICE QUESTION
30 sec • 1 pt
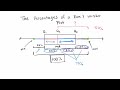
What percentage of data falls between the minimum and Q1 in a box and whisker plot?
50%
25%
75%
10%
4.
MULTIPLE CHOICE QUESTION
30 sec • 1 pt
How is the data between Q1 and the median represented in terms of percentage?
10%
50%
25%
75%
5.
MULTIPLE CHOICE QUESTION
30 sec • 1 pt
What does it mean if the sections between quartiles in a box plot are not of equal width?
The data is evenly distributed
The data is skewed
The data is normally distributed
The data is not varied
6.
MULTIPLE CHOICE QUESTION
30 sec • 1 pt
What is the term used to describe the variation in data within a box and whisker plot?
Data median
Data mean
Data spread
Data range
7.
MULTIPLE CHOICE QUESTION
30 sec • 1 pt
What percentage of data falls between the median and Q3?
50%
75%
25%
10%
Access all questions and much more by creating a free account
Create resources
Host any resource
Get auto-graded reports
Continue with Google

Continue with Email
Continue with Microsoft
or continue with

%20(1).png)
Apple
Others
Already have an account?
