Understanding Correlation Coefficient Concepts
Interactive Video
•
Mathematics
•
9th - 10th Grade
•
Practice Problem
•
Hard

Thomas White
FREE Resource
Read more
15 questions
Show all answers
1.
MULTIPLE CHOICE QUESTION
30 sec • 1 pt
What is the main focus of the practice question discussed in the video?
Identifying the fruit with the highest calories
Estimating the correlation coefficient
Determining the fruit with the lowest calories
Calculating the average water content
2.
MULTIPLE CHOICE QUESTION
30 sec • 1 pt
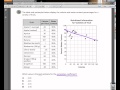
What is the role of the scatter plot in this practice question?
To identify the highest value
To display the data points
To calculate the correlation coefficient
To determine the mean value
3.
MULTIPLE CHOICE QUESTION
30 sec • 1 pt
What is the importance of the table in the practice question?
To determine the highest value
To calculate the correlation coefficient
To list the data points for analysis
To provide a visual representation of the data
4.
MULTIPLE CHOICE QUESTION
30 sec • 1 pt
What does the correlation coefficient indicate?
The total number of data points
How well the data fits a line
The spread of the data
The average value of the data
5.
MULTIPLE CHOICE QUESTION
30 sec • 1 pt
What is the relationship between the correlation coefficient and the line of best fit?
The coefficient identifies outliers
The coefficient determines the number of data points
The coefficient measures the fit of the data to the line
The coefficient calculates the average value
6.
MULTIPLE CHOICE QUESTION
30 sec • 1 pt
What is the first step in estimating the correlation coefficient?
Calculating the mean of the data
Identifying outliers
Drawing a line of best fit
Counting the data points
7.
MULTIPLE CHOICE QUESTION
30 sec • 1 pt
What is the significance of drawing a line of best fit?
To identify outliers
To count the data points
To visualize the data trend
To calculate the mean
Access all questions and much more by creating a free account
Create resources
Host any resource
Get auto-graded reports
Continue with Google

Continue with Email
Continue with Classlink
Continue with Clever
or continue with
Microsoft
%20(1).png)
Apple
Others
Already have an account?
Popular Resources on Wayground

15 questions
Fractions on a Number Line
Quiz
•
3rd Grade
20 questions
Equivalent Fractions
Quiz
•
3rd Grade
25 questions
Multiplication Facts
Quiz
•
5th Grade
54 questions
Analyzing Line Graphs & Tables
Quiz
•
4th Grade
22 questions
fractions
Quiz
•
3rd Grade
20 questions
Main Idea and Details
Quiz
•
5th Grade
20 questions
Context Clues
Quiz
•
6th Grade
15 questions
Equivalent Fractions
Quiz
•
4th Grade
Discover more resources for Mathematics
20 questions
Graphing Inequalities on a Number Line
Quiz
•
6th - 9th Grade
18 questions
SAT Prep: Ratios, Proportions, & Percents
Quiz
•
9th - 10th Grade
12 questions
Exponential Growth and Decay
Quiz
•
9th Grade
12 questions
Parallel Lines Cut by a Transversal
Quiz
•
10th Grade
12 questions
Add and Subtract Polynomials
Quiz
•
9th - 12th Grade
15 questions
Combine Like Terms and Distributive Property
Quiz
•
8th - 9th Grade
20 questions
Function or Not a Function
Quiz
•
8th - 9th Grade
10 questions
Elijah McCoy: Innovations and Impact in Black History
Interactive video
•
6th - 10th Grade