Data Analysis and Box Plots
Interactive Video
•
Mathematics
•
9th - 10th Grade
•
Practice Problem
•
Hard

Thomas White
FREE Resource
Read more
14 questions
Show all answers
1.
MULTIPLE CHOICE QUESTION
30 sec • 1 pt
What is the primary purpose of using box plots in data analysis?
To display the frequency of data points
To compare the distribution of data sets
To calculate the mean of data sets
To show the correlation between variables
2.
MULTIPLE CHOICE QUESTION
30 sec • 1 pt
Which component of a box plot represents the median?
The top of the box
The right whisker
The left whisker
The line inside the box
3.
MULTIPLE CHOICE QUESTION
30 sec • 1 pt
How is a symmetric box plot characterized?
The median is at the top of the box
The whiskers are of unequal length
The box and whiskers are equal on both sides
The box is longer on one side
4.
MULTIPLE CHOICE QUESTION
30 sec • 1 pt
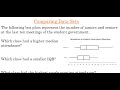
Which class had a higher median attendance?
Juniors
Seniors
Both had the same median
Cannot be determined
5.
MULTIPLE CHOICE QUESTION
30 sec • 1 pt
What is the interquartile range (IQR) used for?
To measure the spread of the middle 50% of data
To find the average of data
To determine the maximum value
To calculate the total range
6.
MULTIPLE CHOICE QUESTION
30 sec • 1 pt
How is variability in data sets assessed?
By analyzing the range
By checking the median
By evaluating the interquartile range
By comparing the mean
7.
MULTIPLE CHOICE QUESTION
30 sec • 1 pt
Which class had the highest single meeting attendance?
Seniors
Both had the same maximum
Cannot be determined
Juniors
Access all questions and much more by creating a free account
Create resources
Host any resource
Get auto-graded reports
Continue with Google

Continue with Email
Continue with Classlink
Continue with Clever
or continue with
Microsoft
%20(1).png)
Apple
Others
Already have an account?
Popular Resources on Wayground

15 questions
Fractions on a Number Line
Quiz
•
3rd Grade
10 questions
Probability Practice
Quiz
•
4th Grade
15 questions
Probability on Number LIne
Quiz
•
4th Grade
20 questions
Equivalent Fractions
Quiz
•
3rd Grade
25 questions
Multiplication Facts
Quiz
•
5th Grade
22 questions
fractions
Quiz
•
3rd Grade
6 questions
Appropriate Chromebook Usage
Lesson
•
7th Grade
10 questions
Greek Bases tele and phon
Quiz
•
6th - 8th Grade
Discover more resources for Mathematics
23 questions
TSI Math Vocabulary
Quiz
•
10th - 12th Grade
15 questions
Graphing Inequalities
Quiz
•
7th - 9th Grade
20 questions
Graphing Inequalities on a Number Line
Quiz
•
6th - 9th Grade
15 questions
Combine Like Terms and Distributive Property
Quiz
•
8th - 9th Grade
10 questions
Plotting Points on a Coordinate Plane: Quadrant 1 Essentials
Interactive video
•
6th - 10th Grade
20 questions
Perfect Squares and Square Roots
Quiz
•
9th Grade
10 questions
Exploring Abiotic and Biotic Factors in Ecosystems
Interactive video
•
6th - 10th Grade
20 questions
Function or Not a Function
Quiz
•
8th - 9th Grade