Understanding Scatter Plots and Relationships
Interactive Video
•
Mathematics
•
9th - 10th Grade
•
Practice Problem
•
Hard

Thomas White
FREE Resource
Read more
15 questions
Show all answers
1.
MULTIPLE CHOICE QUESTION
30 sec • 1 pt
What is the main task when analyzing scatter plot results?
To determine the mode of the data points
To find the mean of the data points
To classify the results and identify relationships
To calculate the median of the data points
2.
MULTIPLE CHOICE QUESTION
30 sec • 1 pt
What is the main focus when classifying scatter plot relationships?
Determining the mode of the data
Identifying the mean of the data
Calculating the median of the data
Classifying the type of relationship
3.
MULTIPLE CHOICE QUESTION
30 sec • 1 pt
What does a positive linear relationship in a scatter plot indicate?
As x increases, y decreases
As x increases, y remains constant
As x decreases, y increases
As x increases, y increases
4.
MULTIPLE CHOICE QUESTION
30 sec • 1 pt
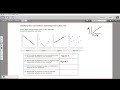
Which figure in the video shows a positive linear relationship?
Figure 2
Figure 1
Figure 4
Figure 3
5.
MULTIPLE CHOICE QUESTION
30 sec • 1 pt
What is the significance of a line of best fit in a scatter plot?
It shows the average of the data points
It calculates the median of the data points
It indicates the mode of the data points
It represents the trend of the data points
6.
MULTIPLE CHOICE QUESTION
30 sec • 1 pt
How can you identify a positive slope in a scatter plot?
The line is horizontal
The line is vertical
The line goes up from left to right
The line goes down from left to right
7.
MULTIPLE CHOICE QUESTION
30 sec • 1 pt
What characterizes a negative linear relationship in a scatter plot?
As x increases, y increases
As x increases, y decreases
As x decreases, y decreases
As x decreases, y increases
Access all questions and much more by creating a free account
Create resources
Host any resource
Get auto-graded reports
Continue with Google

Continue with Email
Continue with Classlink
Continue with Clever
or continue with
Microsoft
%20(1).png)
Apple
Others
Already have an account?
Popular Resources on Wayground

15 questions
Fractions on a Number Line
Quiz
•
3rd Grade
20 questions
Equivalent Fractions
Quiz
•
3rd Grade
25 questions
Multiplication Facts
Quiz
•
5th Grade
29 questions
Alg. 1 Section 5.1 Coordinate Plane
Quiz
•
9th Grade
22 questions
fractions
Quiz
•
3rd Grade
11 questions
FOREST Effective communication
Lesson
•
KG
20 questions
Main Idea and Details
Quiz
•
5th Grade
20 questions
Context Clues
Quiz
•
6th Grade
Discover more resources for Mathematics
29 questions
Alg. 1 Section 5.1 Coordinate Plane
Quiz
•
9th Grade
20 questions
Graphing Inequalities on a Number Line
Quiz
•
6th - 9th Grade
20 questions
Box and Whisker Plots
Quiz
•
9th Grade
18 questions
Exponential Growth and Decay
Quiz
•
9th Grade
20 questions
Function or Not a Function
Quiz
•
8th - 9th Grade
20 questions
SSS/SAS
Quiz
•
9th - 12th Grade
14 questions
Making Inferences From Samples
Quiz
•
7th - 12th Grade
23 questions
CCG - CH8 Polygon angles and area Review
Quiz
•
9th - 12th Grade