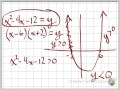
Graphing Nonlinear Inequalities Concepts
Interactive Video
•
Mathematics
•
9th - 10th Grade
•
Practice Problem
•
Hard

Thomas White
FREE Resource
Read more
14 questions
Show all answers
1.
MULTIPLE CHOICE QUESTION
30 sec • 1 pt
What is the main focus of this video tutorial?
Solving nonlinear inequalities by graphing
Solving quadratic equations
Solving linear equations
Solving rational inequalities
2.
MULTIPLE CHOICE QUESTION
30 sec • 1 pt
Which method is traditionally used to solve nonlinear inequalities?
Elimination
Factorization and number lines
Graphing
Substitution
3.
MULTIPLE CHOICE QUESTION
30 sec • 1 pt
What is the first step in the traditional method of solving nonlinear inequalities?
Graphing the function
Testing values on a number line
Finding the critical points
Factoring the polynomial
4.
MULTIPLE CHOICE QUESTION
30 sec • 1 pt
In the traditional method, what do you do after factoring the polynomial?
Simplify the expression
Solve for y
Find the critical values
Graph the polynomial
5.
MULTIPLE CHOICE QUESTION
30 sec • 1 pt
What is the purpose of testing values in different intervals in the traditional method?
To determine the sign of the product in each interval
To graph the function
To simplify the expression
To find the roots of the polynomial
6.
MULTIPLE CHOICE QUESTION
30 sec • 1 pt
What is the main advantage of using the graphing method over the traditional method?
It is faster
It requires less mathematical knowledge
It is more accurate
It does not require testing values on a number line
7.
MULTIPLE CHOICE QUESTION
30 sec • 1 pt
What is the first step in the graphing method for solving nonlinear inequalities?
Finding the critical points
Graphing the polynomial function
Testing values on a number line
Simplifying the expression
Access all questions and much more by creating a free account
Create resources
Host any resource
Get auto-graded reports
Continue with Google

Continue with Email
Continue with Classlink
Continue with Clever
or continue with
Microsoft
%20(1).png)
Apple
Others
Already have an account?
Popular Resources on Wayground

15 questions
Fractions on a Number Line
Quiz
•
3rd Grade
10 questions
Probability Practice
Quiz
•
4th Grade
15 questions
Probability on Number LIne
Quiz
•
4th Grade
20 questions
Equivalent Fractions
Quiz
•
3rd Grade
25 questions
Multiplication Facts
Quiz
•
5th Grade
22 questions
fractions
Quiz
•
3rd Grade
6 questions
Appropriate Chromebook Usage
Lesson
•
7th Grade
10 questions
Greek Bases tele and phon
Quiz
•
6th - 8th Grade
Discover more resources for Mathematics
23 questions
TSI Math Vocabulary
Quiz
•
10th - 12th Grade
15 questions
Graphing Inequalities
Quiz
•
7th - 9th Grade
20 questions
Graphing Inequalities on a Number Line
Quiz
•
6th - 9th Grade
15 questions
Combine Like Terms and Distributive Property
Quiz
•
8th - 9th Grade
10 questions
Plotting Points on a Coordinate Plane: Quadrant 1 Essentials
Interactive video
•
6th - 10th Grade
20 questions
Perfect Squares and Square Roots
Quiz
•
9th Grade
10 questions
Exploring Abiotic and Biotic Factors in Ecosystems
Interactive video
•
6th - 10th Grade
20 questions
Function or Not a Function
Quiz
•
8th - 9th Grade