Simulation of Probability and Preferences
Interactive Video
•
Mathematics
•
6th - 7th Grade
•
Practice Problem
•
Hard

Thomas White
FREE Resource
Read more
10 questions
Show all answers
1.
MULTIPLE CHOICE QUESTION
30 sec • 1 pt
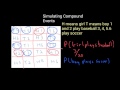
What does 'H' represent in the chart used for simulating compound events?
Soccer
Baseball
Girl
Boy
2.
MULTIPLE CHOICE QUESTION
30 sec • 1 pt
Which numbers correspond to playing baseball in the simulation?
All numbers
1 and 2
3 and 4
5 and 6
3.
MULTIPLE CHOICE QUESTION
30 sec • 1 pt
What is the probability that a girl plays baseball according to the simulation?
1/20
3/20
5/20
7/20
4.
MULTIPLE CHOICE QUESTION
30 sec • 1 pt
Which numbers correspond to playing soccer in the simulation?
All numbers
Only 5 and 6
3, 4, 5, and 6
1 and 2
5.
MULTIPLE CHOICE QUESTION
30 sec • 1 pt
What is the probability that a boy plays soccer according to the simulation?
3/20
9/20
5/20
7/20
6.
MULTIPLE CHOICE QUESTION
30 sec • 1 pt
In the cheesecake preference simulation, what do numbers 1 and 2 represent?
Like and dislike equally
Don't like cheesecake
Like cheesecake
Indifferent
7.
MULTIPLE CHOICE QUESTION
30 sec • 1 pt
What is the probability that at least two out of five people don't like cheesecake?
1/3
2/3
1/2
1/4
Access all questions and much more by creating a free account
Create resources
Host any resource
Get auto-graded reports
Continue with Google

Continue with Email
Continue with Classlink
Continue with Clever
or continue with
Microsoft
%20(1).png)
Apple
Others
Already have an account?
Similar Resources on Wayground

6 questions
CLEAN : FILE: Thailand emergency: prominent student leader Panusaya Sithijirawattanakul
Interactive video
•
6th - 8th Grade
7 questions
Understanding Feedback and Behavior
Interactive video
•
4th - 8th Grade
6 questions
CLEAN : STOCKSHOTS: Sony headquarters in Tokyo
Interactive video
•
6th - 7th Grade
6 questions
Fire destroys much of 16th century Peru church
Interactive video
•
6th - 7th Grade
6 questions
CLEAN : Phony war in Mariupol in the south eastern Ukraine
Interactive video
•
6th - 7th Grade
Popular Resources on Wayground
15 questions
Fractions on a Number Line
Quiz
•
3rd Grade
20 questions
Equivalent Fractions
Quiz
•
3rd Grade
25 questions
Multiplication Facts
Quiz
•
5th Grade
29 questions
Alg. 1 Section 5.1 Coordinate Plane
Quiz
•
9th Grade
22 questions
fractions
Quiz
•
3rd Grade
11 questions
FOREST Effective communication
Lesson
•
KG
20 questions
Main Idea and Details
Quiz
•
5th Grade
20 questions
Context Clues
Quiz
•
6th Grade
Discover more resources for Mathematics
36 questions
6th Grade Math STAAR Review
Quiz
•
6th Grade
14 questions
Volume of rectangular prisms
Quiz
•
7th Grade
20 questions
Graphing Inequalities on a Number Line
Quiz
•
6th - 9th Grade
23 questions
Solve and Graph Inequalities
Quiz
•
6th Grade
15 questions
Distributive Property & Review
Quiz
•
6th Grade
10 questions
Mean, Median, Mode, and Range
Quiz
•
7th Grade
17 questions
Area of a parallelogram
Quiz
•
6th Grade
23 questions
Mean median mode and range
Quiz
•
7th Grade