Class Boundaries and Histograms
Interactive Video
•
Mathematics
•
9th - 10th Grade
•
Practice Problem
•
Hard

Thomas White
FREE Resource
Read more
12 questions
Show all answers
1.
MULTIPLE CHOICE QUESTION
30 sec • 1 pt
What is the main focus of this tutorial?
Bar charts and pie charts
Histograms and frequency polygons
Line graphs and scatter plots
Box plots and dot plots
2.
MULTIPLE CHOICE QUESTION
30 sec • 1 pt
What is the first step in solving Problem 1?
Using the frequency table
Calculating class mid-values
Estimating the mode
Drawing the histogram
3.
MULTIPLE CHOICE QUESTION
30 sec • 1 pt
How do you calculate the lower class boundary for the first interval?
By multiplying 0 and 1
By dividing 1 by 0
By subtracting 1 from 0
By adding 0 and 1, then dividing by 2
4.
MULTIPLE CHOICE QUESTION
30 sec • 1 pt
What is the upper class boundary for the interval 11 to 20?
20.5
22.5
21.5
23.5
5.
MULTIPLE CHOICE QUESTION
30 sec • 1 pt
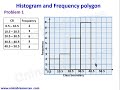
What is the height of the bar for the interval 30.5 to 40.5 in the histogram?
6
7
8
9
6.
MULTIPLE CHOICE QUESTION
30 sec • 1 pt
How is the mode estimated from the histogram?
By finding the shortest bar
By calculating the average of all bars
By summing all frequencies
By identifying the tallest bar
7.
MULTIPLE CHOICE QUESTION
30 sec • 1 pt
What is the first step in drawing a frequency polygon?
Calculating the range
Drawing vertical lines
Finding the midpoint of the bars
Calculating the mean of the data
Access all questions and much more by creating a free account
Create resources
Host any resource
Get auto-graded reports
Continue with Google

Continue with Email
Continue with Classlink
Continue with Clever
or continue with
Microsoft
%20(1).png)
Apple
Others
Already have an account?
Popular Resources on Wayground

15 questions
Fractions on a Number Line
Quiz
•
3rd Grade
10 questions
Probability Practice
Quiz
•
4th Grade
15 questions
Probability on Number LIne
Quiz
•
4th Grade
20 questions
Equivalent Fractions
Quiz
•
3rd Grade
25 questions
Multiplication Facts
Quiz
•
5th Grade
22 questions
fractions
Quiz
•
3rd Grade
6 questions
Appropriate Chromebook Usage
Lesson
•
7th Grade
10 questions
Greek Bases tele and phon
Quiz
•
6th - 8th Grade
Discover more resources for Mathematics
23 questions
TSI Math Vocabulary
Quiz
•
10th - 12th Grade
15 questions
Graphing Inequalities
Quiz
•
7th - 9th Grade
20 questions
Graphing Inequalities on a Number Line
Quiz
•
6th - 9th Grade
15 questions
Combine Like Terms and Distributive Property
Quiz
•
8th - 9th Grade
10 questions
Plotting Points on a Coordinate Plane: Quadrant 1 Essentials
Interactive video
•
6th - 10th Grade
20 questions
Perfect Squares and Square Roots
Quiz
•
9th Grade
10 questions
Exploring Abiotic and Biotic Factors in Ecosystems
Interactive video
•
6th - 10th Grade
20 questions
Function or Not a Function
Quiz
•
8th - 9th Grade