Understanding Z-scores and Statistics
Interactive Video
•
Mathematics
•
9th - 10th Grade
•
Practice Problem
•
Hard

Thomas White
FREE Resource
Read more
16 questions
Show all answers
1.
MULTIPLE CHOICE QUESTION
30 sec • 1 pt
What does the 68-95-99.7 rule refer to in statistics?
The percentage of data within one, two, and three standard deviations of the mean in a normal distribution.
The percentage of data within one, two, and three standard deviations of the mean in a bimodal distribution.
The percentage of data within one, two, and three standard deviations of the mean in a skewed distribution.
The percentage of data within one, two, and three standard deviations of the mean in a uniform distribution.
2.
MULTIPLE CHOICE QUESTION
30 sec • 1 pt
What is the purpose of a Z-score in statistics?
To calculate the range of a data set.
To determine the probability of a data point occurring within a normal distribution.
To find the mode of a data set.
To measure the central tendency of a data set.
3.
MULTIPLE CHOICE QUESTION
30 sec • 1 pt
In the Z-score formula, what does 'x bar' represent?
The median of the data set.
The range of the data set.
The mode of the data set.
The mean of the data set.
4.
MULTIPLE CHOICE QUESTION
30 sec • 1 pt
If a data point is exactly at the mean, what is its Z-score?
It cannot be determined.
-1
0
1
5.
MULTIPLE CHOICE QUESTION
30 sec • 1 pt
How is a Z-score calculated?
By multiplying the data point by the standard deviation.
By adding the mean to the data point and dividing by the standard deviation.
By subtracting the mean from the data point and dividing by the standard deviation.
By dividing the data point by the mean.
6.
MULTIPLE CHOICE QUESTION
30 sec • 1 pt
What does a Z-score of 1 indicate?
The data point is two standard deviations above the mean.
The data point is at the mean.
The data point is one standard deviation below the mean.
The data point is one standard deviation above the mean.
7.
MULTIPLE CHOICE QUESTION
30 sec • 1 pt
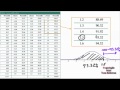
What is the purpose of the normal distribution table?
To identify the mode of a data set.
To find the mean of a data set.
To determine the percentile rank of a Z-score.
To calculate the standard deviation of a data set.
Access all questions and much more by creating a free account
Create resources
Host any resource
Get auto-graded reports
Continue with Google

Continue with Email
Continue with Classlink
Continue with Clever
or continue with
Microsoft
%20(1).png)
Apple
Others
Already have an account?
