Inequalities and Graph Interpretation
Interactive Video
•
Mathematics
•
9th - 10th Grade
•
Practice Problem
•
Medium

Thomas White
Used 1+ times
FREE Resource
Read more
15 questions
Show all answers
1.
MULTIPLE CHOICE QUESTION
30 sec • 1 pt
What is the main focus of the video tutorial?
Calculating derivatives
Graphing exponential functions
Understanding linear inequalities
Solving quadratic equations
2.
MULTIPLE CHOICE QUESTION
30 sec • 1 pt
What is the budget constraint mentioned in the problem?
Maximum of $100
Maximum of $80
Minimum of $30
Minimum of $50
3.
MULTIPLE CHOICE QUESTION
30 sec • 1 pt
What does the variable 'x' represent in the inequality?
Dollars spent on chicken
Pounds of chicken
Pounds of hamburger
Dollars spent on hamburger
4.
MULTIPLE CHOICE QUESTION
30 sec • 1 pt
How much does a pound of chicken cost?
$10
$12
$5
$8
5.
MULTIPLE CHOICE QUESTION
30 sec • 1 pt
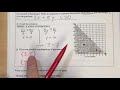
What is the x-intercept of the inequality graph?
5
10
15
20
6.
MULTIPLE CHOICE QUESTION
30 sec • 1 pt
What is the y-intercept of the inequality graph?
16
14
12
10
7.
MULTIPLE CHOICE QUESTION
30 sec • 1 pt
What is the slope of the line in the graph?
5/8
3/5
8/5
5/3
Access all questions and much more by creating a free account
Create resources
Host any resource
Get auto-graded reports
Continue with Google

Continue with Email
Continue with Classlink
Continue with Clever
or continue with
Microsoft
%20(1).png)
Apple
Others
Already have an account?
Popular Resources on Wayground

7 questions
History of Valentine's Day
Interactive video
•
4th Grade
15 questions
Fractions on a Number Line
Quiz
•
3rd Grade
20 questions
Equivalent Fractions
Quiz
•
3rd Grade
25 questions
Multiplication Facts
Quiz
•
5th Grade
22 questions
fractions
Quiz
•
3rd Grade
15 questions
Valentine's Day Trivia
Quiz
•
3rd Grade
20 questions
Main Idea and Details
Quiz
•
5th Grade
20 questions
Context Clues
Quiz
•
6th Grade
Discover more resources for Mathematics
20 questions
Graphing Inequalities on a Number Line
Quiz
•
6th - 9th Grade
20 questions
Exponent Properties
Quiz
•
9th Grade
15 questions
Combine Like Terms and Distributive Property
Quiz
•
8th - 9th Grade
20 questions
Function or Not a Function
Quiz
•
8th - 9th Grade
10 questions
Factor Quadratic Expressions with Various Coefficients
Quiz
•
9th - 12th Grade
10 questions
Elijah McCoy: Innovations and Impact in Black History
Interactive video
•
6th - 10th Grade
21 questions
Factoring Trinomials (a=1)
Quiz
•
9th Grade
5 questions
Triangle Congruence Theorems
Interactive video
•
9th - 12th Grade