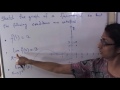
Graph Behavior and Continuity Concepts
Interactive Video
•
Mathematics
•
9th - 10th Grade
•
Practice Problem
•
Hard

Thomas White
FREE Resource
Read more
11 questions
Show all answers
1.
MULTIPLE CHOICE QUESTION
30 sec • 1 pt
What is the main task discussed in the video?
Sketching a graph based on conditions
Solving equations
Calculating integrals
Finding the derivative
2.
MULTIPLE CHOICE QUESTION
30 sec • 1 pt
What is the value of f(1) according to the given conditions?
1
2
-1
3
3.
MULTIPLE CHOICE QUESTION
30 sec • 1 pt
What is the limit of f(x) as x approaches 1 from the left?
0
2
3
-1
4.
MULTIPLE CHOICE QUESTION
30 sec • 1 pt
What is the limit of f(x) as x approaches 1 from the right?
0
3
2
-1
5.
MULTIPLE CHOICE QUESTION
30 sec • 1 pt
How many functions can satisfy the given conditions?
Many
Two
Only one
None
6.
MULTIPLE CHOICE QUESTION
30 sec • 1 pt
What point is plotted on the graph based on f(1)?
(1, 3)
(1, 2)
(1, -1)
(1, 0)
7.
MULTIPLE CHOICE QUESTION
30 sec • 1 pt
What does the open circle on the graph represent as x approaches 1 from the left?
A filled point
A discontinuity
A limit of -1
A limit of 3
Access all questions and much more by creating a free account
Create resources
Host any resource
Get auto-graded reports
Continue with Google

Continue with Email
Continue with Classlink
Continue with Clever
or continue with
Microsoft
%20(1).png)
Apple
Others
Already have an account?
Popular Resources on Wayground

7 questions
History of Valentine's Day
Interactive video
•
4th Grade
15 questions
Fractions on a Number Line
Quiz
•
3rd Grade
20 questions
Equivalent Fractions
Quiz
•
3rd Grade
25 questions
Multiplication Facts
Quiz
•
5th Grade
22 questions
fractions
Quiz
•
3rd Grade
15 questions
Valentine's Day Trivia
Quiz
•
3rd Grade
20 questions
Main Idea and Details
Quiz
•
5th Grade
20 questions
Context Clues
Quiz
•
6th Grade
Discover more resources for Mathematics
20 questions
Graphing Inequalities on a Number Line
Quiz
•
6th - 9th Grade
20 questions
Exponent Properties
Quiz
•
9th Grade
15 questions
Combine Like Terms and Distributive Property
Quiz
•
8th - 9th Grade
20 questions
Function or Not a Function
Quiz
•
8th - 9th Grade
10 questions
Factor Quadratic Expressions with Various Coefficients
Quiz
•
9th - 12th Grade
10 questions
Elijah McCoy: Innovations and Impact in Black History
Interactive video
•
6th - 10th Grade
21 questions
Factoring Trinomials (a=1)
Quiz
•
9th Grade
5 questions
Triangle Congruence Theorems
Interactive video
•
9th - 12th Grade