Understanding Correlation and Linear Functions
Interactive Video
•
Mathematics
•
9th - 10th Grade
•
Practice Problem
•
Hard

Thomas White
FREE Resource
Read more
10 questions
Show all answers
1.
MULTIPLE CHOICE QUESTION
30 sec • 1 pt
What does a closed circle on a graph indicate about the domain?
The graph has a vertical asymptote.
The graph is undefined at that point.
The value is included in the domain.
The value is not included in the domain.
2.
MULTIPLE CHOICE QUESTION
30 sec • 1 pt
How can you evaluate a function at a specific point using a calculator?
By storing the value in the calculator and using it in the equation.
By substituting the value directly into the equation.
By using the calculator's solve function.
By graphing the function and finding the intersection.
3.
MULTIPLE CHOICE QUESTION
30 sec • 1 pt
What is the first step in solving for an unknown in a perimeter problem?
Divide all terms by the number of sides.
Use the quadratic formula.
Combine like terms to simplify the equation.
Set the equation equal to zero.
4.
MULTIPLE CHOICE QUESTION
30 sec • 1 pt
If a student spent $284 on tickets, how can you determine the number of tickets bought?
By dividing the total cost by the price per ticket.
By rewriting the cost equation in terms of the number of tickets.
By estimating based on average ticket prices.
By using a graph to find the intersection point.
5.
MULTIPLE CHOICE QUESTION
30 sec • 1 pt
What does an r-value of -0.98 indicate about a scatterplot?
There is a weak positive correlation.
There is a perfect positive correlation.
There is a strong negative correlation.
There is no correlation.
6.
MULTIPLE CHOICE QUESTION
30 sec • 1 pt
What happens to the inequality sign when you divide by a negative number?
It becomes undefined.
It becomes an equality.
It flips direction.
It remains the same.
7.
MULTIPLE CHOICE QUESTION
30 sec • 1 pt
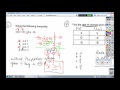
How do you calculate the slope from a table of values?
By finding the difference in y-values divided by the difference in x-values.
By adding all the y-values together.
By subtracting the smallest x-value from the largest y-value.
By multiplying the x-values by the y-values.
Access all questions and much more by creating a free account
Create resources
Host any resource
Get auto-graded reports
Continue with Google

Continue with Email
Continue with Microsoft
or continue with

%20(1).png)
Apple
Others
Already have an account?
