Data Representation and Analysis Concepts
Interactive Video
•
Mathematics
•
3rd - 4th Grade
•
Practice Problem
•
Hard

Thomas White
FREE Resource
Read more
9 questions
Show all answers
1.
MULTIPLE CHOICE QUESTION
30 sec • 1 pt
What is the main focus of the lesson for this week?
Calculus and derivatives
Algebraic equations
Geometry and shapes
Data representation using graphs
2.
MULTIPLE CHOICE QUESTION
30 sec • 1 pt
Which of the following is NOT a vocabulary word for this lesson?
Dot plot
Frequency table
Histogram
Pictograph
3.
MULTIPLE CHOICE QUESTION
30 sec • 1 pt
What is a frequency table used for?
To display data in a circular format
To organize data and show the number of occurrences
To show the relationship between variables
To calculate averages
4.
MULTIPLE CHOICE QUESTION
30 sec • 1 pt
How does a dot plot represent data?
Through circular segments
By placing dots or Xs on a number line
With lines connecting data points
Using bars of different heights
5.
MULTIPLE CHOICE QUESTION
30 sec • 1 pt
What is the primary feature of a bar graph?
It uses dots to represent data
It uses bars to represent data
It uses lines to connect data points
It uses pictures to represent data
6.
MULTIPLE CHOICE QUESTION
30 sec • 1 pt
In a pictograph, what does the key represent?
The total number of data points
The title of the graph
What each symbol or picture represents
The scale of the graph
7.
MULTIPLE CHOICE QUESTION
30 sec • 1 pt
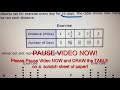
What was the context of the example problem discussed?
A runner tracking his exercise routine
A student calculating his grades
A chef measuring ingredients
A teacher planning lessons
Access all questions and much more by creating a free account
Create resources
Host any resource
Get auto-graded reports
Continue with Google

Continue with Email
Continue with Microsoft
or continue with

%20(1).png)
Apple
Others
Already have an account?
