Understanding Linear Functions and Slope
Interactive Video
•
Mathematics
•
9th - 10th Grade
•
Practice Problem
•
Hard

Thomas White
FREE Resource
Read more
15 questions
Show all answers
1.
MULTIPLE CHOICE QUESTION
30 sec • 1 pt
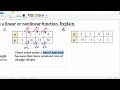
What is the first step in determining if a graph represents a linear or non-linear function?
Check if the graph is colored.
See if the graph is labeled.
Count the number of points on the graph.
Determine if the graph curves or is straight.
2.
MULTIPLE CHOICE QUESTION
30 sec • 1 pt
What characteristic of a graph indicates it is non-linear?
It is horizontal.
It is a straight line.
It has a constant slope.
It curves.
3.
MULTIPLE CHOICE QUESTION
30 sec • 1 pt
What does a straight line on a graph signify?
The function is quadratic.
The function is undefined.
The function has a constant rate of change.
The function is non-linear.
4.
MULTIPLE CHOICE QUESTION
30 sec • 1 pt
What is another term for the rate of change in a linear function?
Axis
Slope
Intercept
Vertex
5.
MULTIPLE CHOICE QUESTION
30 sec • 1 pt
How do you calculate the slope of a linear function?
Divide the change in X by the change in Y.
Multiply the change in Y by the change in X.
Subtract the change in Y from the change in X.
Divide the change in Y by the change in X.
6.
MULTIPLE CHOICE QUESTION
30 sec • 1 pt
In a linear function, what does a constant rate of change imply?
The graph is a parabola.
The graph is a circle.
The graph is a straight line.
The graph is curved.
7.
MULTIPLE CHOICE QUESTION
30 sec • 1 pt
What is the slope of a function if the change in Y is 5 and the change in X is 1?
5
10
1
0.2
Access all questions and much more by creating a free account
Create resources
Host any resource
Get auto-graded reports
Continue with Google

Continue with Email
Continue with Classlink
Continue with Clever
or continue with
Microsoft
%20(1).png)
Apple
Others
Already have an account?
Popular Resources on Wayground

15 questions
Fractions on a Number Line
Quiz
•
3rd Grade
10 questions
Probability Practice
Quiz
•
4th Grade
15 questions
Probability on Number LIne
Quiz
•
4th Grade
20 questions
Equivalent Fractions
Quiz
•
3rd Grade
25 questions
Multiplication Facts
Quiz
•
5th Grade
22 questions
fractions
Quiz
•
3rd Grade
6 questions
Appropriate Chromebook Usage
Lesson
•
7th Grade
10 questions
Greek Bases tele and phon
Quiz
•
6th - 8th Grade
Discover more resources for Mathematics
23 questions
TSI Math Vocabulary
Quiz
•
10th - 12th Grade
15 questions
Graphing Inequalities
Quiz
•
7th - 9th Grade
20 questions
Graphing Inequalities on a Number Line
Quiz
•
6th - 9th Grade
15 questions
Combine Like Terms and Distributive Property
Quiz
•
8th - 9th Grade
10 questions
Plotting Points on a Coordinate Plane: Quadrant 1 Essentials
Interactive video
•
6th - 10th Grade
20 questions
Perfect Squares and Square Roots
Quiz
•
9th Grade
10 questions
Exploring Abiotic and Biotic Factors in Ecosystems
Interactive video
•
6th - 10th Grade
20 questions
Function or Not a Function
Quiz
•
8th - 9th Grade