Analyzing Correlation in Scatterplots
Interactive Video
•
Mathematics
•
9th - 10th Grade
•
Practice Problem
•
Hard

Thomas White
FREE Resource
Read more
15 questions
Show all answers
1.
MULTIPLE CHOICE QUESTION
30 sec • 1 pt
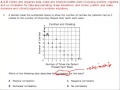
What does the scatterplot created by the dentist illustrate?
The relationship between brushing frequency and cavities
The relationship between age and cavities
The relationship between flossing frequency and cavities
The relationship between diet and cavities
2.
MULTIPLE CHOICE QUESTION
30 sec • 1 pt
What is the main task described in the video regarding the scatterplot?
To calculate the total number of patients
To identify the type of correlation in the data
To find the average flossing frequency
To determine the number of cavities
3.
MULTIPLE CHOICE QUESTION
30 sec • 1 pt
What does the term 'correlation' refer to in the context of the scatterplot?
A random distribution of data points
A specific type of graph
A method of counting data points
A relationship between two variables
4.
MULTIPLE CHOICE QUESTION
30 sec • 1 pt
What should you consider when analyzing a scatterplot for correlation?
The color of the data points
The general trend of the data points
The size of the graph
The number of data points
5.
MULTIPLE CHOICE QUESTION
30 sec • 1 pt
What is the first step in analyzing a scatterplot for correlation?
Measuring the distance between points
Counting the data points
Identifying the trend of the data points
Calculating the average of the variables
6.
MULTIPLE CHOICE QUESTION
30 sec • 1 pt
How can you describe the scatter of points in the scatterplot?
They are evenly spaced
They form a perfect line
They are scattered with a general trend
They are tightly clustered
7.
MULTIPLE CHOICE QUESTION
30 sec • 1 pt
What general trend is observed in the scatterplot regarding cavities and flossing frequency?
Cavities increase as flossing frequency increases
Cavities decrease as flossing frequency increases
Cavities remain constant regardless of flossing frequency
Cavities fluctuate randomly with flossing frequency
Access all questions and much more by creating a free account
Create resources
Host any resource
Get auto-graded reports
Continue with Google

Continue with Email
Continue with Classlink
Continue with Clever
or continue with
Microsoft
%20(1).png)
Apple
Others
Already have an account?
Popular Resources on Wayground

15 questions
Fractions on a Number Line
Quiz
•
3rd Grade
20 questions
Equivalent Fractions
Quiz
•
3rd Grade
25 questions
Multiplication Facts
Quiz
•
5th Grade
29 questions
Alg. 1 Section 5.1 Coordinate Plane
Quiz
•
9th Grade
22 questions
fractions
Quiz
•
3rd Grade
11 questions
FOREST Effective communication
Lesson
•
KG
20 questions
Main Idea and Details
Quiz
•
5th Grade
20 questions
Context Clues
Quiz
•
6th Grade
Discover more resources for Mathematics
29 questions
Alg. 1 Section 5.1 Coordinate Plane
Quiz
•
9th Grade
20 questions
Graphing Inequalities on a Number Line
Quiz
•
6th - 9th Grade
20 questions
Box and Whisker Plots
Quiz
•
9th Grade
18 questions
Exponential Growth and Decay
Quiz
•
9th Grade
20 questions
Function or Not a Function
Quiz
•
8th - 9th Grade
20 questions
SSS/SAS
Quiz
•
9th - 12th Grade
14 questions
Making Inferences From Samples
Quiz
•
7th - 12th Grade
23 questions
CCG - CH8 Polygon angles and area Review
Quiz
•
9th - 12th Grade