
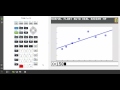
Graphing Functions and Data Analysis

Interactive Video
•
Mathematics
•
9th - 10th Grade
•
Practice Problem
•
Hard

Thomas White
FREE Resource
Read more
11 questions
Show all answers
1.
MULTIPLE CHOICE QUESTION
30 sec • 1 pt
What is the primary tool used in this lesson for graphing exercises?
TI-84 calculator
TI-89 calculator
HP calculator
Casio calculator
2.
MULTIPLE CHOICE QUESTION
30 sec • 1 pt
What type of function are we modeling with in this lesson?
Linear function
Exponential function
Quadratic function
Logarithmic function
3.
MULTIPLE CHOICE QUESTION
30 sec • 1 pt
What is the purpose of creating a scatter plot in this lesson?
To determine the median
To calculate the mean
To visualize data trends
To find the maximum value
4.
MULTIPLE CHOICE QUESTION
30 sec • 1 pt
What is the form of the equation obtained from linear regression?
y = ax + b
y = a^x + b
y = ax^2 + bx + c
y = a/x + b
5.
MULTIPLE CHOICE QUESTION
30 sec • 1 pt
What can the linear regression model be used for?
To find derivatives
To make predictions
To solve quadratic equations
To calculate integrals
6.
MULTIPLE CHOICE QUESTION
30 sec • 1 pt
In the example problem, where did Brian take photos?
SeaWorld
Disney World
Universal Studios
Six Flags
7.
MULTIPLE CHOICE QUESTION
30 sec • 1 pt
What is the first step in creating a scatter plot for the example problem?
Find the median
Determine the mode
Input data into list one and list two
Calculate the mean
Access all questions and much more by creating a free account
Create resources
Host any resource
Get auto-graded reports

Continue with Google

Continue with Email

Continue with Microsoft
or continue with

%20(1).png)
Apple

Others
By signing up, you agree to our Terms of Service & Privacy Policy
Already have an account?

