Measures of Central Tendency and Data Representation
Interactive Video
•
Mathematics
•
6th - 7th Grade
•
Practice Problem
•
Hard

Thomas White
FREE Resource
Read more
10 questions
Show all answers
1.
MULTIPLE CHOICE QUESTION
30 sec • 1 pt
What is the primary focus of measures of central tendency?
To calculate the difference between the highest and lowest values
To determine the spread of data
To find the average of a data set
To identify the most frequent data point
2.
MULTIPLE CHOICE QUESTION
30 sec • 1 pt
Which measure of central tendency is defined as the middle value in an ordered data set?
Mode
Range
Median
Mean
3.
MULTIPLE CHOICE QUESTION
30 sec • 1 pt
What is the key difference between a histogram and a bar graph?
Bars in histograms touch each other
Histograms use lines instead of bars
Bar graphs show frequency distribution
Histograms display categorical data
4.
MULTIPLE CHOICE QUESTION
30 sec • 1 pt
In a dot plot, what does each dot represent?
A category
A frequency
A range
A data point
5.
MULTIPLE CHOICE QUESTION
30 sec • 1 pt
How do you calculate the mean from a set of numbers?
Add all numbers and divide by the number of values
Find the middle value
Identify the most frequent number
Subtract the smallest number from the largest
6.
MULTIPLE CHOICE QUESTION
30 sec • 1 pt
What is the purpose of a frequency table in creating a histogram?
To list all data points
To show the range of data
To display the frequency of data within intervals
To calculate the mean
7.
MULTIPLE CHOICE QUESTION
30 sec • 1 pt
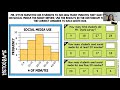
When interpreting a histogram, what does the height of each bar represent?
The total number of data points
The frequency of data within that interval
The average value of the data
The range of the data
Access all questions and much more by creating a free account
Create resources
Host any resource
Get auto-graded reports
Continue with Google

Continue with Email
Continue with Microsoft
or continue with

%20(1).png)
Apple
Others
Already have an account?
