Market Analysis and Probability Concepts
Interactive Video
•
Business
•
9th - 10th Grade
•
Practice Problem
•
Hard

Thomas White
FREE Resource
Read more
9 questions
Show all answers
1.
MULTIPLE CHOICE QUESTION
30 sec • 1 pt
What is the main question addressed in this tutorial?
Will people buy Coke Z over Coke R?
How to improve the taste of Coke Z?
How to increase sales of Coke Z?
What is the best marketing strategy for Coke R?
2.
MULTIPLE CHOICE QUESTION
30 sec • 1 pt
How many people strongly agree to buy Coke Z over Coke R?
150
450
300
600
3.
MULTIPLE CHOICE QUESTION
30 sec • 1 pt
What is the total number of survey participants?
2,500
4,000
3,000
3,500
4.
MULTIPLE CHOICE QUESTION
30 sec • 1 pt
How is relative frequency calculated?
By multiplying the number of agreements by total participants
By adding the number of agreements and disagreements
By subtracting the number of disagreements from agreements
By dividing the number of agreements by total participants
5.
MULTIPLE CHOICE QUESTION
30 sec • 1 pt
What is cumulative probability?
The probability of a single event
The sum of probabilities up to a certain point
The difference between two probabilities
The average of all probabilities
6.
MULTIPLE CHOICE QUESTION
30 sec • 1 pt
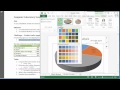
Which chart is recommended for visualizing categories?
Scatter plot
Histogram
Pie chart
Line chart
7.
MULTIPLE CHOICE QUESTION
30 sec • 1 pt
What percentage of people might buy the new Coke?
20%
80%
30%
50%
Access all questions and much more by creating a free account
Create resources
Host any resource
Get auto-graded reports
Continue with Google

Continue with Email
Continue with Classlink
Continue with Clever
or continue with
Microsoft
%20(1).png)
Apple
Others
Already have an account?
