Analyzing Data from Graphs
Interactive Video
•
Mathematics
•
3rd - 4th Grade
•
Practice Problem
•
Hard

Thomas White
Used 2+ times
FREE Resource
Read more
15 questions
Show all answers
1.
MULTIPLE CHOICE QUESTION
30 sec • 1 pt
What should students have ready before starting the quiz?
A calculator
A computer
A textbook
A piece of paper numbered 1 through 6
2.
MULTIPLE CHOICE QUESTION
30 sec • 1 pt
What is the main topic of the quiz?
Chapter 11
Chapter 10
Chapter 9
Chapter 8
3.
MULTIPLE CHOICE QUESTION
30 sec • 1 pt
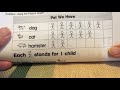
In the picture graph, what does each stick person represent?
One pet
One child
One family
One classroom
4.
MULTIPLE CHOICE QUESTION
30 sec • 1 pt
How many children have a cat according to the picture graph?
9
7
5
3
5.
MULTIPLE CHOICE QUESTION
30 sec • 1 pt
What is the purpose of the picture graph discussed?
To show the number of classrooms
To show the number of toys
To show the number of children with pets
To show the number of books
6.
MULTIPLE CHOICE QUESTION
30 sec • 1 pt
Do more children have dogs than cats?
Equal number
Yes
No
Not sure
7.
MULTIPLE CHOICE QUESTION
30 sec • 1 pt
Is it true that six children have dogs?
Maybe
Yes
No
Not mentioned
Access all questions and much more by creating a free account
Create resources
Host any resource
Get auto-graded reports
Continue with Google

Continue with Email
Continue with Classlink
Continue with Clever
or continue with
Microsoft
%20(1).png)
Apple
Others
Already have an account?
Popular Resources on Wayground

15 questions
Fractions on a Number Line
Quiz
•
3rd Grade
20 questions
Equivalent Fractions
Quiz
•
3rd Grade
25 questions
Multiplication Facts
Quiz
•
5th Grade
22 questions
fractions
Quiz
•
3rd Grade
20 questions
Main Idea and Details
Quiz
•
5th Grade
20 questions
Context Clues
Quiz
•
6th Grade
15 questions
Equivalent Fractions
Quiz
•
4th Grade
20 questions
Figurative Language Review
Quiz
•
6th Grade
Discover more resources for Mathematics
15 questions
Fractions on a Number Line
Quiz
•
3rd Grade
20 questions
Equivalent Fractions
Quiz
•
3rd Grade
22 questions
fractions
Quiz
•
3rd Grade
15 questions
Equivalent Fractions
Quiz
•
4th Grade
10 questions
Area
Quiz
•
3rd Grade
20 questions
Identifying Fractions
Quiz
•
3rd Grade
77 questions
Mixed Multiplication and Division Facts
Quiz
•
4th Grade
100 questions
100 multiplication facts
Quiz
•
3rd Grade