Graphing Utilities and Functions
Interactive Video
•
Mathematics
•
9th - 10th Grade
•
Practice Problem
•
Hard

Thomas White
FREE Resource
Read more
12 questions
Show all answers
1.
MULTIPLE CHOICE QUESTION
30 sec • 1 pt
What are the two methods mentioned for graphing a function?
Using a graphing utility and drawing freehand
Using a graphing utility and by hand
Using a computer and drawing freehand
Using a calculator and by hand
2.
MULTIPLE CHOICE QUESTION
30 sec • 1 pt
What is the first step when using a graphing utility to graph an equation?
Enter the equation into the calculator
Solve for x
Plot the points
Solve for y
3.
MULTIPLE CHOICE QUESTION
30 sec • 1 pt
In the example provided, what is the equation being graphed?
y = x^2 + 10x + 39
y = 1/30 * x^2 * (x^4 - 10x^2 + 39)
y = 1/30 * x * (x^4 - 10x^2 + 39)
y = x^3 - 10x + 39
4.
MULTIPLE CHOICE QUESTION
30 sec • 1 pt
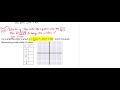
What is the purpose of creating a table of values when graphing?
To find the maximum and minimum points
To determine the slope of the line
To plot points and understand the graph's shape
To calculate the derivative
5.
MULTIPLE CHOICE QUESTION
30 sec • 1 pt
Which values are typically included in a standard table of values?
0, 1, 2, 3
-1, 0, 1
-2, -1, 0, 1, 2
-3, -2, -1, 0, 1, 2, 3
6.
MULTIPLE CHOICE QUESTION
30 sec • 1 pt
Why is it important to adjust the viewing window on a graphing utility?
To change the color of the graph
To adjust the scale of the axes
To see the entire graph and accurately represent the data
To zoom in on specific points
7.
MULTIPLE CHOICE QUESTION
30 sec • 1 pt
What should you do if you can't see the graph after hitting the graph button?
Turn off the calculator
Check the equation for errors
Adjust the viewing window
Re-enter the equation
Access all questions and much more by creating a free account
Create resources
Host any resource
Get auto-graded reports
Continue with Google

Continue with Email
Continue with Classlink
Continue with Clever
or continue with
Microsoft
%20(1).png)
Apple
Others
Already have an account?
Popular Resources on Wayground

7 questions
History of Valentine's Day
Interactive video
•
4th Grade
15 questions
Fractions on a Number Line
Quiz
•
3rd Grade
20 questions
Equivalent Fractions
Quiz
•
3rd Grade
25 questions
Multiplication Facts
Quiz
•
5th Grade
22 questions
fractions
Quiz
•
3rd Grade
15 questions
Valentine's Day Trivia
Quiz
•
3rd Grade
20 questions
Main Idea and Details
Quiz
•
5th Grade
20 questions
Context Clues
Quiz
•
6th Grade
Discover more resources for Mathematics
20 questions
Graphing Inequalities on a Number Line
Quiz
•
6th - 9th Grade
20 questions
Exponent Properties
Quiz
•
9th Grade
15 questions
Combine Like Terms and Distributive Property
Quiz
•
8th - 9th Grade
20 questions
Function or Not a Function
Quiz
•
8th - 9th Grade
10 questions
Factor Quadratic Expressions with Various Coefficients
Quiz
•
9th - 12th Grade
10 questions
Elijah McCoy: Innovations and Impact in Black History
Interactive video
•
6th - 10th Grade
21 questions
Factoring Trinomials (a=1)
Quiz
•
9th Grade
5 questions
Triangle Congruence Theorems
Interactive video
•
9th - 12th Grade