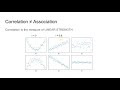
Understanding Correlation and R Values
Interactive Video
•
Mathematics
•
9th - 10th Grade
•
Practice Problem
•
Hard

Thomas White
FREE Resource
Read more
35 questions
Show all answers
1.
MULTIPLE CHOICE QUESTION
30 sec • 1 pt
What is the primary focus of the video tutorial?
Studying hypothesis testing
Understanding the concept of correlation
Learning about probability
Exploring statistical distributions
2.
MULTIPLE CHOICE QUESTION
30 sec • 1 pt
What is correlation primarily used to measure?
The probability of an event
The strength of a non-linear relationship
The mean of a dataset
The strength of a linear relationship
3.
MULTIPLE CHOICE QUESTION
30 sec • 1 pt
How is correlation different from association?
Neither measures linear strength
Correlation measures linear strength, while association does not
Association measures linear strength, while correlation does not
Both measure the same thing
4.
MULTIPLE CHOICE QUESTION
30 sec • 1 pt
What does an R value of 0 indicate?
Strong negative correlation
No linear correlation
Strong positive correlation
Perfect correlation
5.
MULTIPLE CHOICE QUESTION
30 sec • 1 pt
What is considered a weak correlation in statistics?
R value between 0 and 0.4
R value between 0.4 and 0.7
R value between 0.7 and 1
R value of exactly 1
6.
MULTIPLE CHOICE QUESTION
30 sec • 1 pt
What does a positive R value indicate about the direction of a scatter plot?
The scatter plot has a positive slope
The scatter plot has a negative slope
The scatter plot is vertical
The scatter plot is horizontal
7.
MULTIPLE CHOICE QUESTION
30 sec • 1 pt
What is the R value for a perfect line?
1
0
0.5
-1
Access all questions and much more by creating a free account
Create resources
Host any resource
Get auto-graded reports
Continue with Google

Continue with Email
Continue with Classlink
Continue with Clever
or continue with
Microsoft
%20(1).png)
Apple
Others
Already have an account?
Similar Resources on Wayground
Popular Resources on Wayground

15 questions
Fractions on a Number Line
Quiz
•
3rd Grade
10 questions
Probability Practice
Quiz
•
4th Grade
15 questions
Probability on Number LIne
Quiz
•
4th Grade
20 questions
Equivalent Fractions
Quiz
•
3rd Grade
25 questions
Multiplication Facts
Quiz
•
5th Grade
22 questions
fractions
Quiz
•
3rd Grade
6 questions
Appropriate Chromebook Usage
Lesson
•
7th Grade
10 questions
Greek Bases tele and phon
Quiz
•
6th - 8th Grade
Discover more resources for Mathematics
23 questions
TSI Math Vocabulary
Quiz
•
10th - 12th Grade
15 questions
Graphing Inequalities
Quiz
•
7th - 9th Grade
20 questions
Graphing Inequalities on a Number Line
Quiz
•
6th - 9th Grade
15 questions
Combine Like Terms and Distributive Property
Quiz
•
8th - 9th Grade
10 questions
Plotting Points on a Coordinate Plane: Quadrant 1 Essentials
Interactive video
•
6th - 10th Grade
20 questions
Perfect Squares and Square Roots
Quiz
•
9th Grade
10 questions
Exploring Abiotic and Biotic Factors in Ecosystems
Interactive video
•
6th - 10th Grade
20 questions
Function or Not a Function
Quiz
•
8th - 9th Grade