Line Plots and Volume Calculations
Interactive Video
•
Mathematics
•
5th - 6th Grade
•
Practice Problem
•
Hard

Thomas White
FREE Resource
Read more
9 questions
Show all answers
1.
MULTIPLE CHOICE QUESTION
30 sec • 1 pt
What is the main focus of lesson 11.1?
Understanding bar graphs
Making and interpreting line plots
Learning about pie charts
Studying scatter plots
2.
MULTIPLE CHOICE QUESTION
30 sec • 1 pt
What did Emma measure in her science experiment?
The volumes of colored water in bottles
The weight of different objects
The temperature of liquids
The height of plants
3.
MULTIPLE CHOICE QUESTION
30 sec • 1 pt
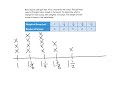
How do you represent the number of bottles for each volume on a line plot?
Using X's
Using squares
Using circles
Using triangles
4.
MULTIPLE CHOICE QUESTION
30 sec • 1 pt
What is the first step in calculating the total volume of bottles?
Multiplying each volume by the number of bottles
Dividing the total number of bottles by the total volume
Subtracting the smallest volume from the largest
Adding all the volumes together
5.
MULTIPLE CHOICE QUESTION
30 sec • 1 pt
How is the total volume redistributed among the bottles?
By removing water from each bottle
By dividing the total volume by the number of bottles
By multiplying the total volume by the number of bottles
By adding more water to each bottle
6.
MULTIPLE CHOICE QUESTION
30 sec • 1 pt
What does Ben's sports example involve?
Selling baseball bats
Selling tennis rackets
Selling golf tees by the scoop
Selling golf balls
7.
MULTIPLE CHOICE QUESTION
30 sec • 1 pt
How are the weights of the scoops represented on a line plot?
With triangles
With circles
With squares
With X's
Access all questions and much more by creating a free account
Create resources
Host any resource
Get auto-graded reports
Continue with Google

Continue with Email
Continue with Classlink
Continue with Clever
or continue with
Microsoft
%20(1).png)
Apple
Others
Already have an account?
