- Resource Library
- Math
- Data And Graphing
- Data Representation
- Understanding Graphs And Data Representation
Understanding Graphs and Data Representation
Interactive Video
•
Mathematics
•
1st - 2nd Grade
•
Hard

Thomas White
FREE Resource
Read more
8 questions
Show all answers
1.
MULTIPLE CHOICE QUESTION
30 sec • 1 pt
What is the primary purpose of reading a graph?
To solve math equations
To write stories
To count objects in categories
To draw pictures
2.
MULTIPLE CHOICE QUESTION
30 sec • 1 pt
What does a graph typically show?
A list of names
A timeline of events
A chart of information
A map of a city
3.
MULTIPLE CHOICE QUESTION
30 sec • 1 pt
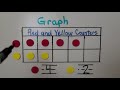
In the graph with red and yellow counters, which category has more counters?
None
Yellow
Red
Both are equal
4.
MULTIPLE CHOICE QUESTION
30 sec • 1 pt
What is the title of the graph with blue and red squares?
Blue and Red Squares
Red and Yellow Squares
Green and Red Squares
Blue and Yellow Squares
5.
MULTIPLE CHOICE QUESTION
30 sec • 1 pt
How many blue squares are there in the graph?
Two
One
Three
Four
6.
MULTIPLE CHOICE QUESTION
30 sec • 1 pt
If another blue counter is added, will there still be more red than blue?
No, blue will have more
Yes, there will still be more red
They will be equal
It cannot be determined
7.
MULTIPLE CHOICE QUESTION
30 sec • 1 pt
What happens when one more yellow counter is added to the graph with equal red and yellow counters?
Yellow will have more
Red will have more
It will not change
They will remain equal
Access all questions and much more by creating a free account
Create resources
Host any resource
Get auto-graded reports
Continue with Google

Continue with Email
Continue with Microsoft
or continue with

%20(1).png)
Apple
Others
Already have an account?
