Proportional Relationships and Constants
Interactive Video
•
Mathematics
•
6th - 7th Grade
•
Hard

Thomas White
FREE Resource
Read more
28 questions
Show all answers
1.
MULTIPLE CHOICE QUESTION
30 sec • 1 pt
What is the equation used to describe a proportional relationship?
y = k + x
y = x/k
y = kx
y = mx + b
2.
MULTIPLE CHOICE QUESTION
30 sec • 1 pt
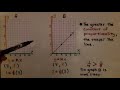
What does the constant of proportionality (k) indicate in a graph?
The steepness of the graph
The color of the graph
The length of the graph
The y-intercept of the graph
3.
MULTIPLE CHOICE QUESTION
30 sec • 1 pt
What is the relationship between the constant of proportionality and the steepness of a line?
No relationship
The constant does not affect steepness
The greater the constant, the steeper the line
The smaller the constant, the steeper the line
4.
MULTIPLE CHOICE QUESTION
30 sec • 1 pt
What is the effect of a larger constant of proportionality on a graph?
The graph becomes vertical
The graph becomes horizontal
The graph becomes more steep
The graph becomes less steep
5.
MULTIPLE CHOICE QUESTION
30 sec • 1 pt
What is the effect of a smaller constant of proportionality on a graph?
The graph becomes less steep
The graph becomes more steep
The graph becomes horizontal
The graph becomes vertical
6.
MULTIPLE CHOICE QUESTION
30 sec • 1 pt
In the coordinate plane example, what does the x-axis represent?
Height in feet
Distance in miles
Time in minutes
Speed in mph
7.
MULTIPLE CHOICE QUESTION
30 sec • 1 pt
If a graph passes through the origin, what does it indicate about the relationship?
It is a quadratic relationship
It is not proportional
It is a linear relationship
It is a proportional relationship
Create a free account and access millions of resources
Create resources
Host any resource
Get auto-graded reports
Continue with Google

Continue with Email
Continue with Classlink
Continue with Clever
or continue with
Microsoft
%20(1).png)
Apple
Others
By signing up, you agree to our Terms of Service & Privacy Policy
Already have an account?
Popular Resources on Wayground

20 questions
Brand Labels
Quiz
•
5th - 12th Grade
11 questions
NEASC Extended Advisory
Lesson
•
9th - 12th Grade
10 questions
Ice Breaker Trivia: Food from Around the World
Quiz
•
3rd - 12th Grade
10 questions
Boomer ⚡ Zoomer - Holiday Movies
Quiz
•
KG - University
25 questions
Multiplication Facts
Quiz
•
5th Grade
22 questions
Adding Integers
Quiz
•
6th Grade
10 questions
Multiplication and Division Unknowns
Quiz
•
3rd Grade
20 questions
Multiplying and Dividing Integers
Quiz
•
7th Grade
Discover more resources for Mathematics
22 questions
Adding Integers
Quiz
•
6th Grade
20 questions
Multiplying and Dividing Integers
Quiz
•
7th Grade
10 questions
Adding and Subtracting Integers
Quiz
•
6th Grade
20 questions
Adding and Subtracting Integers
Quiz
•
6th Grade
21 questions
Convert Fractions, Decimals, and Percents
Quiz
•
6th Grade
16 questions
Adding and Subtracting Integers
Quiz
•
7th Grade
20 questions
One step Equations
Quiz
•
6th Grade
20 questions
Triangle Sum and Exterior Angle Theorem Practice
Quiz
•
7th Grade