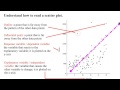
Influential Points and Variables in Scatterplots
Interactive Video
•
Mathematics
•
9th - 10th Grade
•
Hard

Thomas White
FREE Resource
Read more
18 questions
Show all answers
1.
MULTIPLE CHOICE QUESTION
30 sec • 1 pt
What is the primary purpose of understanding scatterplot vocabulary?
To accurately interpret data relationships
To create colorful graphs
To memorize statistical terms
To confuse the audience
2.
MULTIPLE CHOICE QUESTION
30 sec • 1 pt
Where is the explanatory variable typically placed on a scatterplot?
On the y-axis
On the x-axis
In the title
In the legend
3.
MULTIPLE CHOICE QUESTION
30 sec • 1 pt
Which variable is considered the dependent variable in a scatterplot?
The one that is independent
The one that responds to changes
The one that is always constant
The one on the x-axis
4.
MULTIPLE CHOICE QUESTION
30 sec • 1 pt
What is the role of the response variable in a scatterplot?
It is unaffected by the explanatory variable
It causes changes in the explanatory variable
It is always plotted on the x-axis
It responds to changes in the explanatory variable
5.
MULTIPLE CHOICE QUESTION
30 sec • 1 pt
What assumption is made about the explanatory variable?
It is always constant
It is assumed to explain changes in the response variable
It is always plotted on the y-axis
It is always the cause of the response variable
6.
MULTIPLE CHOICE QUESTION
30 sec • 1 pt
Which variable is plotted on the y-axis in a scatterplot?
Independent variable
Control variable
Explanatory variable
Response variable
7.
MULTIPLE CHOICE QUESTION
30 sec • 1 pt
In the context of scatterplots, what does the term 'explanatory variable' imply?
It is the variable that remains constant
It is always plotted on the y-axis
It is the variable that explains changes in the response variable
It is the variable that is explained by the response variable
Access all questions and much more by creating a free account
Create resources
Host any resource
Get auto-graded reports
Continue with Google

Continue with Email
Continue with Classlink
Continue with Clever
or continue with
Microsoft
%20(1).png)
Apple
Others
Already have an account?
Popular Resources on Wayground

15 questions
Fractions on a Number Line
Quiz
•
3rd Grade
20 questions
Equivalent Fractions
Quiz
•
3rd Grade
25 questions
Multiplication Facts
Quiz
•
5th Grade
29 questions
Alg. 1 Section 5.1 Coordinate Plane
Quiz
•
9th Grade
22 questions
fractions
Quiz
•
3rd Grade
11 questions
FOREST Effective communication
Lesson
•
KG
20 questions
Main Idea and Details
Quiz
•
5th Grade
20 questions
Context Clues
Quiz
•
6th Grade
Discover more resources for Mathematics
29 questions
Alg. 1 Section 5.1 Coordinate Plane
Quiz
•
9th Grade
20 questions
Graphing Inequalities on a Number Line
Quiz
•
6th - 9th Grade
20 questions
Box and Whisker Plots
Quiz
•
9th Grade
18 questions
Exponential Growth and Decay
Quiz
•
9th Grade
20 questions
Function or Not a Function
Quiz
•
8th - 9th Grade
20 questions
SSS/SAS
Quiz
•
9th - 12th Grade
14 questions
Making Inferences From Samples
Quiz
•
7th - 12th Grade
23 questions
CCG - CH8 Polygon angles and area Review
Quiz
•
9th - 12th Grade