Statistics Concepts and Applications
Interactive Video
•
Mathematics
•
9th - 10th Grade
•
Hard

Thomas White
FREE Resource
Read more
8 questions
Show all answers
1.
MULTIPLE CHOICE QUESTION
30 sec • 1 pt
What is the primary focus of Unit 1 in AP Statistics?
Probability and distributions
Statistical inference
Exploring one-variable data
Exploring two-variable data
2.
MULTIPLE CHOICE QUESTION
30 sec • 1 pt
Which of the following is NOT a component of summary statistics for a quantitative variable?
Color
Center
Spread
Shape
3.
MULTIPLE CHOICE QUESTION
30 sec • 1 pt
What is a statistic in the context of quantitative data?
A number describing a sample
A number describing a population
A graph of the data
A type of data collection method
4.
MULTIPLE CHOICE QUESTION
30 sec • 1 pt
How does an outlier affect the mean of a data set?
It has no effect
It pulls the mean towards itself
It pushes the mean away from itself
It makes the mean zero
5.
MULTIPLE CHOICE QUESTION
30 sec • 1 pt
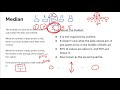
What is the median of a data set?
The average of all values
The most frequently occurring value
The sum of all values
The middle value when data is ordered
6.
MULTIPLE CHOICE QUESTION
30 sec • 1 pt
Why is using a calculator beneficial for finding the mean and median?
It is faster and reduces human error
It provides a visual representation
It can only calculate the mean
It is required by the curriculum
7.
MULTIPLE CHOICE QUESTION
30 sec • 1 pt
What does the 85th percentile indicate about a data point?
It is below 85% of the data
It is above 85% of the data
It is the median of the data
It is the average of the data
Access all questions and much more by creating a free account
Create resources
Host any resource
Get auto-graded reports
Continue with Google

Continue with Email
Continue with Classlink
Continue with Clever
or continue with
Microsoft
%20(1).png)
Apple
Others
Already have an account?
Popular Resources on Wayground

15 questions
Fractions on a Number Line
Quiz
•
3rd Grade
20 questions
Equivalent Fractions
Quiz
•
3rd Grade
25 questions
Multiplication Facts
Quiz
•
5th Grade
29 questions
Alg. 1 Section 5.1 Coordinate Plane
Quiz
•
9th Grade
22 questions
fractions
Quiz
•
3rd Grade
11 questions
FOREST Effective communication
Lesson
•
KG
20 questions
Main Idea and Details
Quiz
•
5th Grade
20 questions
Context Clues
Quiz
•
6th Grade
Discover more resources for Mathematics
29 questions
Alg. 1 Section 5.1 Coordinate Plane
Quiz
•
9th Grade
20 questions
Graphing Inequalities on a Number Line
Quiz
•
6th - 9th Grade
20 questions
Box and Whisker Plots
Quiz
•
9th Grade
18 questions
Exponential Growth and Decay
Quiz
•
9th Grade
20 questions
Function or Not a Function
Quiz
•
8th - 9th Grade
20 questions
SSS/SAS
Quiz
•
9th - 12th Grade
14 questions
Making Inferences From Samples
Quiz
•
7th - 12th Grade
23 questions
CCG - CH8 Polygon angles and area Review
Quiz
•
9th - 12th Grade