Distance-Time Graph Analysis
Interactive Video
•
Mathematics
•
6th - 7th Grade
•
Hard

Thomas White
FREE Resource
Read more
15 questions
Show all answers
1.
MULTIPLE CHOICE QUESTION
30 sec • 1 pt
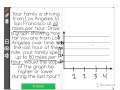
What is the initial speed of the family driving from Los Angeles to San Francisco?
70 MPH
80 MPH
60 MPH
50 MPH
2.
MULTIPLE CHOICE QUESTION
30 sec • 1 pt
On a graph, which axis is typically used to represent time?
X-axis
Z-axis
W-axis
Y-axis
3.
MULTIPLE CHOICE QUESTION
30 sec • 1 pt
What is the starting point of the graph in terms of distance and time?
60 miles, 1 hour
120 miles, 2 hours
180 miles, 3 hours
0 miles, 0 hours
4.
MULTIPLE CHOICE QUESTION
30 sec • 1 pt
What does the y-axis represent in the graph?
Time
Acceleration
Distance
Speed
5.
MULTIPLE CHOICE QUESTION
30 sec • 1 pt
What unit is used to mark increments on the graph in this scenario?
90 miles
60 miles
120 miles
30 miles
6.
MULTIPLE CHOICE QUESTION
30 sec • 1 pt
After 2 hours of travel at 60 MPH, how far has the family traveled?
60 miles
120 miles
180 miles
240 miles
7.
MULTIPLE CHOICE QUESTION
30 sec • 1 pt
What is the total distance covered after 3 hours at 60 MPH?
120 miles
240 miles
180 miles
300 miles
Access all questions and much more by creating a free account
Create resources
Host any resource
Get auto-graded reports
Continue with Google

Continue with Email
Continue with Microsoft
or continue with

%20(1).png)
Apple
Others
Already have an account?
