Graphing Nonlinear Inequalities and Circles
Interactive Video
•
Mathematics
•
9th - 10th Grade
•
Hard

Thomas White
FREE Resource
Read more
15 questions
Show all answers
1.
MULTIPLE CHOICE QUESTION
30 sec • 1 pt
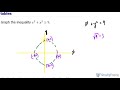
What is the inequality that needs to be graphed in this lesson?
x^2 + y^2 < 9
x^2 + y^2 > 9
x^2 + y^2 ≤ 9
x^2 + y^2 ≥ 9
2.
MULTIPLE CHOICE QUESTION
30 sec • 1 pt
What is the first step in graphing the given inequality?
Plotting points on the graph
Changing the inequality to an equation
Shading the region
Testing a point
3.
MULTIPLE CHOICE QUESTION
30 sec • 1 pt
What shape does the equation x^2 + y^2 = 9 represent?
Ellipse
Hyperbola
Parabola
Circle
4.
MULTIPLE CHOICE QUESTION
30 sec • 1 pt
How is the radius of the circle determined from the equation x^2 + y^2 = 9?
By subtracting 1 from the constant
By multiplying the constant by 2
By taking the square root of the constant
By dividing the constant by 2
5.
MULTIPLE CHOICE QUESTION
30 sec • 1 pt
Which points are plotted to form the circle?
(0, 0), (3, 3), (-3, -3), (3, -3)
(0, 0), (3, 3), (-3, 0), (0, 3)
(0, 0), (3, 0), (0, 3), (-3, -3)
(0, 3), (3, 0), (-3, 0), (0, -3)
6.
MULTIPLE CHOICE QUESTION
30 sec • 1 pt
What type of line is used to connect the points on the circle for a non-strict inequality?
Dotted line
No line
Dashed line
Solid line
7.
MULTIPLE CHOICE QUESTION
30 sec • 1 pt
What does a non-strict inequality symbol indicate?
The inequality is greater than
The inequality is less than
The inequality excludes equality
The inequality includes equality
Access all questions and much more by creating a free account
Create resources
Host any resource
Get auto-graded reports
Continue with Google

Continue with Email
Continue with Classlink
Continue with Clever
or continue with
Microsoft
%20(1).png)
Apple
Others
Already have an account?
