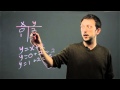
Evaluating Linear Functions and T-Charts
Interactive Video
•
Mathematics
•
6th - 7th Grade
•
Hard

Thomas White
FREE Resource
Read more
15 questions
Show all answers
1.
MULTIPLE CHOICE QUESTION
30 sec • 1 pt
What is a T-Chart primarily used for?
To memorize multiplication tables
To find values in an equation
To draw geometric shapes
To solve word problems
2.
MULTIPLE CHOICE QUESTION
30 sec • 1 pt
In the equation y = x + 2, what does the '2' represent?
The y-intercept
The slope of the line
The x-intercept
The variable
3.
MULTIPLE CHOICE QUESTION
30 sec • 1 pt
What is the first step in using a T-Chart for an equation?
Choose a value for x
Graph the equation
Solve for y
Find the slope
4.
MULTIPLE CHOICE QUESTION
30 sec • 1 pt
What does the equation y = x + 2 represent?
A constant equation
A cubic equation
A linear equation
A quadratic equation
5.
MULTIPLE CHOICE QUESTION
30 sec • 1 pt
If x = 0 in the equation y = x + 2, what is the value of y?
3
2
1
0
6.
MULTIPLE CHOICE QUESTION
30 sec • 1 pt
What is the value of y when x = 1 in the equation y = x + 2?
3
1
2
4
7.
MULTIPLE CHOICE QUESTION
30 sec • 1 pt
When x = 2, what is the corresponding y value in the equation y = x + 2?
3
5
2
4
Access all questions and much more by creating a free account
Create resources
Host any resource
Get auto-graded reports
Continue with Google

Continue with Email
Continue with Classlink
Continue with Clever
or continue with
Microsoft
%20(1).png)
Apple
Others
Already have an account?
