Car Purchasing Decisions and Data Analysis
Interactive Video
•
Mathematics
•
9th - 10th Grade
•
Hard

Thomas White
FREE Resource
Read more
10 questions
Show all answers
1.
MULTIPLE CHOICE QUESTION
30 sec • 1 pt
What is the initial budget given for purchasing a car in the activity?
$20,000
$15,000
$10,000
$25,000
2.
MULTIPLE CHOICE QUESTION
30 sec • 1 pt
Which of the following details is NOT required when choosing a car?
Make
Year
Model
Fuel Type
3.
MULTIPLE CHOICE QUESTION
30 sec • 1 pt
If you buy a car for $12,000, how much budget will you have left?
$12,000
$15,000
$8,000
$10,000
4.
MULTIPLE CHOICE QUESTION
30 sec • 1 pt
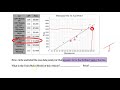
What does a point below the trend line in the graph indicate?
Average price
Overpriced
Expensive
Good value
5.
MULTIPLE CHOICE QUESTION
30 sec • 1 pt
What should you consider when evaluating if a car is a good value?
Horsepower
Fuel efficiency
Brand
Color
6.
MULTIPLE CHOICE QUESTION
30 sec • 1 pt
How can data help in making car purchasing decisions?
By listing all car models
By showing price trends
By providing color options
By offering discounts
7.
MULTIPLE CHOICE QUESTION
30 sec • 1 pt
What is the first step in finding the mean of a set of numbers?
Dividing by the number of numbers
Multiplying the numbers
Adding all the numbers
Subtracting the smallest number
Access all questions and much more by creating a free account
Create resources
Host any resource
Get auto-graded reports
Continue with Google

Continue with Email
Continue with Classlink
Continue with Clever
or continue with
Microsoft
%20(1).png)
Apple
Others
Already have an account?
Popular Resources on Wayground

15 questions
Fractions on a Number Line
Quiz
•
3rd Grade
20 questions
Equivalent Fractions
Quiz
•
3rd Grade
25 questions
Multiplication Facts
Quiz
•
5th Grade
29 questions
Alg. 1 Section 5.1 Coordinate Plane
Quiz
•
9th Grade
22 questions
fractions
Quiz
•
3rd Grade
11 questions
FOREST Effective communication
Lesson
•
KG
20 questions
Main Idea and Details
Quiz
•
5th Grade
20 questions
Context Clues
Quiz
•
6th Grade
Discover more resources for Mathematics
29 questions
Alg. 1 Section 5.1 Coordinate Plane
Quiz
•
9th Grade
20 questions
Graphing Inequalities on a Number Line
Quiz
•
6th - 9th Grade
20 questions
Box and Whisker Plots
Quiz
•
9th Grade
18 questions
Exponential Growth and Decay
Quiz
•
9th Grade
20 questions
Function or Not a Function
Quiz
•
8th - 9th Grade
20 questions
SSS/SAS
Quiz
•
9th - 12th Grade
14 questions
Making Inferences From Samples
Quiz
•
7th - 12th Grade
23 questions
CCG - CH8 Polygon angles and area Review
Quiz
•
9th - 12th Grade