Understanding Scatter Plots and Best Fit
Interactive Video
•
Mathematics
•
9th - 10th Grade
•
Hard

Thomas White
FREE Resource
Read more
8 questions
Show all answers
1.
MULTIPLE CHOICE QUESTION
30 sec • 1 pt
What is one important application of scatter plots?
Estimating the line of best fit
Determining the median
Finding the maximum value
Calculating the area under the curve
2.
MULTIPLE CHOICE QUESTION
30 sec • 1 pt
What does the line of best fit help to estimate?
The maximum value of the dataset
The average of all data points
The trend or direction of the data
The exact position of each point
3.
MULTIPLE CHOICE QUESTION
30 sec • 1 pt
What is the centroid in the context of a scatter plot?
The point with the lowest x-value
The first point in the dataset
The average point of all x and y values
The point with the highest y-value
4.
MULTIPLE CHOICE QUESTION
30 sec • 1 pt
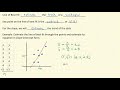
What is the general trend of the data points in the example?
Vertical
Downward to the left
Upward to the right
Horizontal
5.
MULTIPLE CHOICE QUESTION
30 sec • 1 pt
How is the centroid calculated?
By finding the median of x and y values
By averaging the x and y values
By selecting the first and last points
By choosing the point with the highest y-value
6.
MULTIPLE CHOICE QUESTION
30 sec • 1 pt
Why is the centroid important for the line of best fit?
It is a key point that the line must pass through
It is the starting point of the line
It is the lowest point on the graph
It is the highest point on the graph
7.
MULTIPLE CHOICE QUESTION
30 sec • 1 pt
What is the estimated slope of the line of best fit in the example?
3.5
2.5
1.5
0.5
Access all questions and much more by creating a free account
Create resources
Host any resource
Get auto-graded reports
Continue with Google

Continue with Email
Continue with Classlink
Continue with Clever
or continue with
Microsoft
%20(1).png)
Apple
Others
Already have an account?
