Data and Probability Quiz
Interactive Video
•
Mathematics
•
3rd - 4th Grade
•
Practice Problem
•
Hard

Jennifer Brown
FREE Resource
5 questions
Show all answers
1.
MULTIPLE CHOICE QUESTION
30 sec • 1 pt
How many ice cream cones does each icon represent in the pictograph?
One
Two
Three
Four
2.
MULTIPLE CHOICE QUESTION
30 sec • 1 pt
If Celeste ate three cones, how is this represented in the pictograph?
Three full icons
Two full icons
One full icon and one half icon
One full icon
3.
MULTIPLE CHOICE QUESTION
30 sec • 1 pt
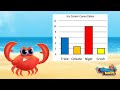
In a bar graph, how do you determine who ate the most ice cream cones?
By the height of the bar
By the width of the bar
By the number of bars
By the color of the bar
4.
MULTIPLE CHOICE QUESTION
30 sec • 1 pt
What is the difference in the number of cones eaten by Nigel and Crush?
Eight
Six
Ten
Four
5.
MULTIPLE CHOICE QUESTION
30 sec • 1 pt
What is the probability of picking a red chewy bear from the group?
Certain
Likely
Impossible
Unlikely
Access all questions and much more by creating a free account
Create resources
Host any resource
Get auto-graded reports
Continue with Google

Continue with Email
Continue with Classlink
Continue with Clever
or continue with
Microsoft
%20(1).png)
Apple
Others
Already have an account?
Popular Resources on Wayground

7 questions
History of Valentine's Day
Interactive video
•
4th Grade
15 questions
Fractions on a Number Line
Quiz
•
3rd Grade
20 questions
Equivalent Fractions
Quiz
•
3rd Grade
25 questions
Multiplication Facts
Quiz
•
5th Grade
22 questions
fractions
Quiz
•
3rd Grade
15 questions
Valentine's Day Trivia
Quiz
•
3rd Grade
20 questions
Main Idea and Details
Quiz
•
5th Grade
20 questions
Context Clues
Quiz
•
6th Grade
Discover more resources for Mathematics
15 questions
Fractions on a Number Line
Quiz
•
3rd Grade
20 questions
Equivalent Fractions
Quiz
•
3rd Grade
22 questions
fractions
Quiz
•
3rd Grade
15 questions
Equivalent Fractions
Quiz
•
4th Grade
18 questions
Comparing Fractions with same numerator or denominator
Quiz
•
3rd Grade
10 questions
Area
Quiz
•
3rd Grade
14 questions
Fractions to Decimals & Decimals to Fractions
Quiz
•
4th Grade
77 questions
Mixed Multiplication and Division Facts
Quiz
•
4th Grade