Data Analysis and Prediction Quiz
Interactive Video
•
Mathematics
•
5th - 6th Grade
•
Practice Problem
•
Hard

Jennifer Brown
FREE Resource
5 questions
Show all answers
1.
MULTIPLE CHOICE QUESTION
30 sec • 1 pt
Which trail had the highest number of hikers according to the pictograph?
Trail 4
Trail 3
Trail 2
Trail 1
2.
MULTIPLE CHOICE QUESTION
30 sec • 1 pt
What is the primary use of a Venn diagram as discussed in the video?
To track mosquito bites
To show the number of hikers
To classify information
To predict future outcomes
3.
MULTIPLE CHOICE QUESTION
30 sec • 1 pt
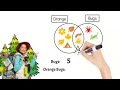
How many bugs were identified as orange in the Venn diagram?
Four
One
Two
Three
4.
MULTIPLE CHOICE QUESTION
30 sec • 1 pt
What does the 'yes' column represent in the yes-no chart?
Hikes without mosquito bites
Hikes with mosquito bites
Hikes with the most hikers
Hikes with the least hikers
5.
MULTIPLE CHOICE QUESTION
30 sec • 1 pt
Based on the data, how likely is it to get a mosquito bite on the next hike?
Unlikely
Impossible
Somewhat likely
Very likely
Access all questions and much more by creating a free account
Create resources
Host any resource
Get auto-graded reports
Continue with Google

Continue with Email
Continue with Classlink
Continue with Clever
or continue with
Microsoft
%20(1).png)
Apple
Others
Already have an account?
Similar Resources on Wayground
Popular Resources on Wayground

15 questions
Fractions on a Number Line
Quiz
•
3rd Grade
20 questions
Equivalent Fractions
Quiz
•
3rd Grade
25 questions
Multiplication Facts
Quiz
•
5th Grade
29 questions
Alg. 1 Section 5.1 Coordinate Plane
Quiz
•
9th Grade
22 questions
fractions
Quiz
•
3rd Grade
11 questions
FOREST Effective communication
Lesson
•
KG
20 questions
Main Idea and Details
Quiz
•
5th Grade
20 questions
Context Clues
Quiz
•
6th Grade
Discover more resources for Mathematics
25 questions
Multiplication Facts
Quiz
•
5th Grade
36 questions
6th Grade Math STAAR Review
Quiz
•
6th Grade
15 questions
Rounding Decimals
Quiz
•
5th Grade
20 questions
Graphing Inequalities on a Number Line
Quiz
•
6th - 9th Grade
23 questions
Solve and Graph Inequalities
Quiz
•
6th Grade
16 questions
Volume of Rectangular Prisms and Cubes
Quiz
•
5th Grade
15 questions
Distributive Property & Review
Quiz
•
6th Grade
15 questions
Converting Mixed Numbers and Improper Fractions
Quiz
•
4th - 5th Grade