Understanding Segmented Bar Charts
Interactive Video
•
Mathematics
•
9th - 10th Grade
•
Practice Problem
•
Hard

Nancy Jackson
FREE Resource
10 questions
Show all answers
1.
MULTIPLE CHOICE QUESTION
30 sec • 1 pt
What is another name for a segmented bar chart?
Divided bar chart
Scatter plot
Pie chart
Line graph
2.
MULTIPLE CHOICE QUESTION
30 sec • 1 pt
How are frequencies represented in a segmented bar chart?
By stacking them on top of each other
By using a pie slice
By placing them side by side
By using a line
3.
MULTIPLE CHOICE QUESTION
30 sec • 1 pt
What should the total percentage add up to in a segmented bar chart using percentages?
150%
50%
100%
75%
4.
MULTIPLE CHOICE QUESTION
30 sec • 1 pt
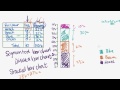
In the example, what color represents the 33% frequency?
Blue
Green
Hazel
Brown
5.
MULTIPLE CHOICE QUESTION
30 sec • 1 pt
What is the total percentage covered by the blue section in the example?
30%
27%
33%
10%
6.
MULTIPLE CHOICE QUESTION
30 sec • 1 pt
How does a segmented bar chart differ from a pie chart?
It uses only one color
It uses a circular representation
It stacks data vertically or horizontally
It represents data in a grid
7.
MULTIPLE CHOICE QUESTION
30 sec • 1 pt
Can a segmented bar chart be represented horizontally?
Yes, it can be horizontal
No, it must be vertical
Only if it is a pie chart
Only if it is a line graph
Access all questions and much more by creating a free account
Create resources
Host any resource
Get auto-graded reports
Continue with Google

Continue with Email
Continue with Classlink
Continue with Clever
or continue with
Microsoft
%20(1).png)
Apple
Others
Already have an account?
Similar Resources on Wayground
Popular Resources on Wayground

15 questions
Fractions on a Number Line
Quiz
•
3rd Grade
20 questions
Equivalent Fractions
Quiz
•
3rd Grade
25 questions
Multiplication Facts
Quiz
•
5th Grade
29 questions
Alg. 1 Section 5.1 Coordinate Plane
Quiz
•
9th Grade
22 questions
fractions
Quiz
•
3rd Grade
11 questions
FOREST Effective communication
Lesson
•
KG
20 questions
Main Idea and Details
Quiz
•
5th Grade
20 questions
Context Clues
Quiz
•
6th Grade
Discover more resources for Mathematics
29 questions
Alg. 1 Section 5.1 Coordinate Plane
Quiz
•
9th Grade
20 questions
Graphing Inequalities on a Number Line
Quiz
•
6th - 9th Grade
20 questions
Box and Whisker Plots
Quiz
•
9th Grade
18 questions
Exponential Growth and Decay
Quiz
•
9th Grade
20 questions
Function or Not a Function
Quiz
•
8th - 9th Grade
20 questions
SSS/SAS
Quiz
•
9th - 12th Grade
14 questions
Making Inferences From Samples
Quiz
•
7th - 12th Grade
23 questions
CCG - CH8 Polygon angles and area Review
Quiz
•
9th - 12th Grade