Dot Distribution Maps Quiz
Interactive Video
•
Geography
•
6th - 7th Grade
•
Practice Problem
•
Hard

Jennifer Brown
FREE Resource
5 questions
Show all answers
1.
MULTIPLE CHOICE QUESTION
30 sec • 1 pt
What is the primary purpose of dot distribution maps?
To show the exact location of cities
To display population densities in various regions
To highlight tourist attractions
To indicate weather patterns
2.
MULTIPLE CHOICE QUESTION
30 sec • 1 pt
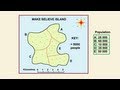
What is the population range of the regions on the make-believe island?
20,000 to 75,000 people
15,000 to 70,000 people
10,000 to 65,000 people
5,000 to 50,000 people
3.
MULTIPLE CHOICE QUESTION
30 sec • 1 pt
How many people does one dot represent on the map?
10,000 people
5,000 people
2,500 people
1,000 people
4.
MULTIPLE CHOICE QUESTION
30 sec • 1 pt
Which region has the highest population on the make-believe island?
Region D
Region C
Region B
Region A
5.
MULTIPLE CHOICE QUESTION
30 sec • 1 pt
Which region is the most densely populated?
Region B
Region E
Region A
Region D
Access all questions and much more by creating a free account
Create resources
Host any resource
Get auto-graded reports
Continue with Google

Continue with Email
Continue with Microsoft
or continue with

%20(1).png)
Apple
Others
Already have an account?
