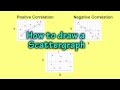
Understanding Scatter Graphs and Correlations
Interactive Video
•
Mathematics
•
9th - 10th Grade
•
Practice Problem
•
Hard

Jennifer Brown
FREE Resource
5 questions
Show all answers
1.
MULTIPLE CHOICE QUESTION
30 sec • 1 pt
What is the primary purpose of a scatter graph?
To illustrate changes over time
To compare the sizes of different categories
To display the frequency of a single variable
To show the relationship between two sets of variables
2.
MULTIPLE CHOICE QUESTION
30 sec • 1 pt
When plotting a scatter graph, which axis should the independent variable be placed on?
Vertical Y-axis
Both axes
Horizontal X-axis
Diagonal axis
3.
MULTIPLE CHOICE QUESTION
30 sec • 1 pt
Why is it important to scale units in even multiples when plotting a scatter graph?
To highlight the dependent variable
To make the graph look more complex
To ensure a consistent scale
To emphasize the independent variable
4.
MULTIPLE CHOICE QUESTION
30 sec • 1 pt
What does a positive correlation in a scatter graph indicate?
Both variables increase together
Both variables decrease together
There is no relationship between the variables
One variable increases while the other decreases
5.
MULTIPLE CHOICE QUESTION
30 sec • 1 pt
Which of the following is an example of a negative correlation?
As the number of blondes increases, intelligence increases
As GDP per capita increases, maternal mortality decreases
As maternal mortality increases, GDP per capita increases
As GDP per capita increases, life expectancy increases
Access all questions and much more by creating a free account
Create resources
Host any resource
Get auto-graded reports
Continue with Google

Continue with Email
Continue with Classlink
Continue with Clever
or continue with
Microsoft
%20(1).png)
Apple
Others
Already have an account?
Similar Resources on Wayground

6 questions
Find the parabola given the vertex and point
Interactive video
•
9th - 10th Grade
6 questions
Coronavirus Model Predicts U.S. Death Toll Of Over 200,000 By October
Interactive video
•
9th - 12th Grade
4 questions
TED-ED: Light seconds, light years, light centuries: How to measure extreme distances - Yuan-Sen Ting
Interactive video
•
KG - University
Popular Resources on Wayground
15 questions
Fractions on a Number Line
Quiz
•
3rd Grade
20 questions
Equivalent Fractions
Quiz
•
3rd Grade
25 questions
Multiplication Facts
Quiz
•
5th Grade
29 questions
Alg. 1 Section 5.1 Coordinate Plane
Quiz
•
9th Grade
22 questions
fractions
Quiz
•
3rd Grade
11 questions
FOREST Effective communication
Lesson
•
KG
20 questions
Main Idea and Details
Quiz
•
5th Grade
20 questions
Context Clues
Quiz
•
6th Grade
Discover more resources for Mathematics
29 questions
Alg. 1 Section 5.1 Coordinate Plane
Quiz
•
9th Grade
20 questions
Graphing Inequalities on a Number Line
Quiz
•
6th - 9th Grade
20 questions
Box and Whisker Plots
Quiz
•
9th Grade
18 questions
Exponential Growth and Decay
Quiz
•
9th Grade
20 questions
Function or Not a Function
Quiz
•
8th - 9th Grade
20 questions
SSS/SAS
Quiz
•
9th - 12th Grade
14 questions
Making Inferences From Samples
Quiz
•
7th - 12th Grade
23 questions
CCG - CH8 Polygon angles and area Review
Quiz
•
9th - 12th Grade