Understanding Bar Graphs
Interactive Video
•
Mathematics
•
2nd - 3rd Grade
•
Easy

Nancy Jackson
Used 1+ times
FREE Resource
10 questions
Show all answers
1.
MULTIPLE CHOICE QUESTION
30 sec • 1 pt
What is the main task introduced in the video?
Conducting a survey
Writing an essay
Creating a bar graph
Creating a pie chart
2.
MULTIPLE CHOICE QUESTION
30 sec • 1 pt
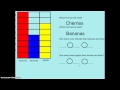
How many students voted for cherries as their favorite fruit?
Four
Six
Eight
Ten
3.
MULTIPLE CHOICE QUESTION
30 sec • 1 pt
How many boxes are colored for bananas on the bar graph?
Eight
Six
Four
Two
4.
MULTIPLE CHOICE QUESTION
30 sec • 1 pt
How many students voted for apples?
Five
Four
Six
Seven
5.
MULTIPLE CHOICE QUESTION
30 sec • 1 pt
Which fruit received the least number of votes?
Grapes
Bananas
Cherries
Apples
6.
MULTIPLE CHOICE QUESTION
30 sec • 1 pt
What is the purpose of using a bar graph in this video?
To list all the fruits available
To calculate the average number of votes
To visualize the number of votes for each fruit
To compare different types of graphs
7.
MULTIPLE CHOICE QUESTION
30 sec • 1 pt
How many more students preferred cherries over bananas?
Eight
Two
Four
Six
Access all questions and much more by creating a free account
Create resources
Host any resource
Get auto-graded reports
Continue with Google

Continue with Email
Continue with Microsoft
or continue with

%20(1).png)
Apple
Others
Already have an account?
