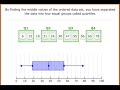
Understanding Box Plots
Interactive Video
•
Mathematics
•
9th - 10th Grade
•
Hard

Jennifer Brown
FREE Resource
5 questions
Show all answers
1.
MULTIPLE CHOICE QUESTION
30 sec • 1 pt
What is the primary purpose of using a box plot?
To display individual data points
To compare two unrelated datasets
To calculate the average of a dataset
To summarize large amounts of data
2.
MULTIPLE CHOICE QUESTION
30 sec • 1 pt
Which value is used to split a dataset into two equal groups?
The median
The range
The mode
The mean
3.
MULTIPLE CHOICE QUESTION
30 sec • 1 pt
What are the five key values needed to construct a box plot?
First quartile, second quartile, third quartile, fourth quartile, fifth quartile
Minimum, maximum, average, sum, count
Lower extreme, lower quartile, median, upper quartile, upper extreme
Mean, mode, range, variance, standard deviation
4.
MULTIPLE CHOICE QUESTION
30 sec • 1 pt
How do you handle a dataset with no single middle value when finding the median?
Use the smallest value
Use the largest value
Use the average of the two middle values
Use the first value
5.
MULTIPLE CHOICE QUESTION
30 sec • 1 pt
What does a shorter distance in a box plot's quartile indicate?
The data is skewed
The data has more outliers
The data is bunched together
The data is more spread out
Access all questions and much more by creating a free account
Create resources
Host any resource
Get auto-graded reports
Continue with Google

Continue with Email
Continue with Classlink
Continue with Clever
or continue with
Microsoft
%20(1).png)
Apple
Others
Already have an account?
Similar Resources on Wayground
Popular Resources on Wayground

15 questions
Fractions on a Number Line
Quiz
•
3rd Grade
20 questions
Equivalent Fractions
Quiz
•
3rd Grade
25 questions
Multiplication Facts
Quiz
•
5th Grade
54 questions
Analyzing Line Graphs & Tables
Quiz
•
4th Grade
22 questions
fractions
Quiz
•
3rd Grade
20 questions
Main Idea and Details
Quiz
•
5th Grade
20 questions
Context Clues
Quiz
•
6th Grade
15 questions
Equivalent Fractions
Quiz
•
4th Grade
Discover more resources for Mathematics
20 questions
Graphing Inequalities on a Number Line
Quiz
•
6th - 9th Grade
18 questions
SAT Prep: Ratios, Proportions, & Percents
Quiz
•
9th - 10th Grade
12 questions
Exponential Growth and Decay
Quiz
•
9th Grade
12 questions
Parallel Lines Cut by a Transversal
Quiz
•
10th Grade
12 questions
Add and Subtract Polynomials
Quiz
•
9th - 12th Grade
15 questions
Combine Like Terms and Distributive Property
Quiz
•
8th - 9th Grade
20 questions
Function or Not a Function
Quiz
•
8th - 9th Grade
10 questions
Elijah McCoy: Innovations and Impact in Black History
Interactive video
•
6th - 10th Grade