
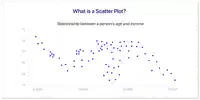
Scatter Plot Intro

Interactive Video
•
Mathematics
•
8th Grade
•
Practice Problem
•
Easy

Susan Rushing
Used 1+ times
FREE Resource
5 questions
Show all answers
1.
MULTIPLE CHOICE QUESTION
30 sec • 1 pt
What is the primary purpose of a scatter plot?
To display data in a circular format.
To show the relationship between two numerical variables.
To compare categories using bars.
To illustrate parts of a whole.
2.
MULTIPLE CHOICE QUESTION
30 sec • Ungraded
Are you enjoying the video lesson? (Be honest, whatever you select is the right answer.)
Yes
No
3.
MULTIPLE CHOICE QUESTION
30 sec • 1 pt
What type of association is present when one variable increases and the other variable also increases?
Negative association
No correlation
Positive association
Random association
4.
MULTIPLE CHOICE QUESTION
30 sec • 1 pt
What characterizes a "weak positive correlation" in a scatter plot?
The dots form a perfect straight line.
The dots are randomly scattered with no discernible pattern.
The dots follow an upward trend, but are widely spread out.
The dots cluster tightly together along a downward trend.
5.
MULTIPLE CHOICE QUESTION
30 sec • 1 pt
What is an outlier in the context of a scatter plot?
A data point that is part of the main trend.
A data point that is identical to all other points.
A data point that is significantly different from the rest of the data.
A data point that represents the average of all other points.
Access all questions and much more by creating a free account
Create resources
Host any resource
Get auto-graded reports

Continue with Google

Continue with Email

Continue with Microsoft
or continue with

%20(1).png)
Apple

Others
By signing up, you agree to our Terms of Service & Privacy Policy
Already have an account?


