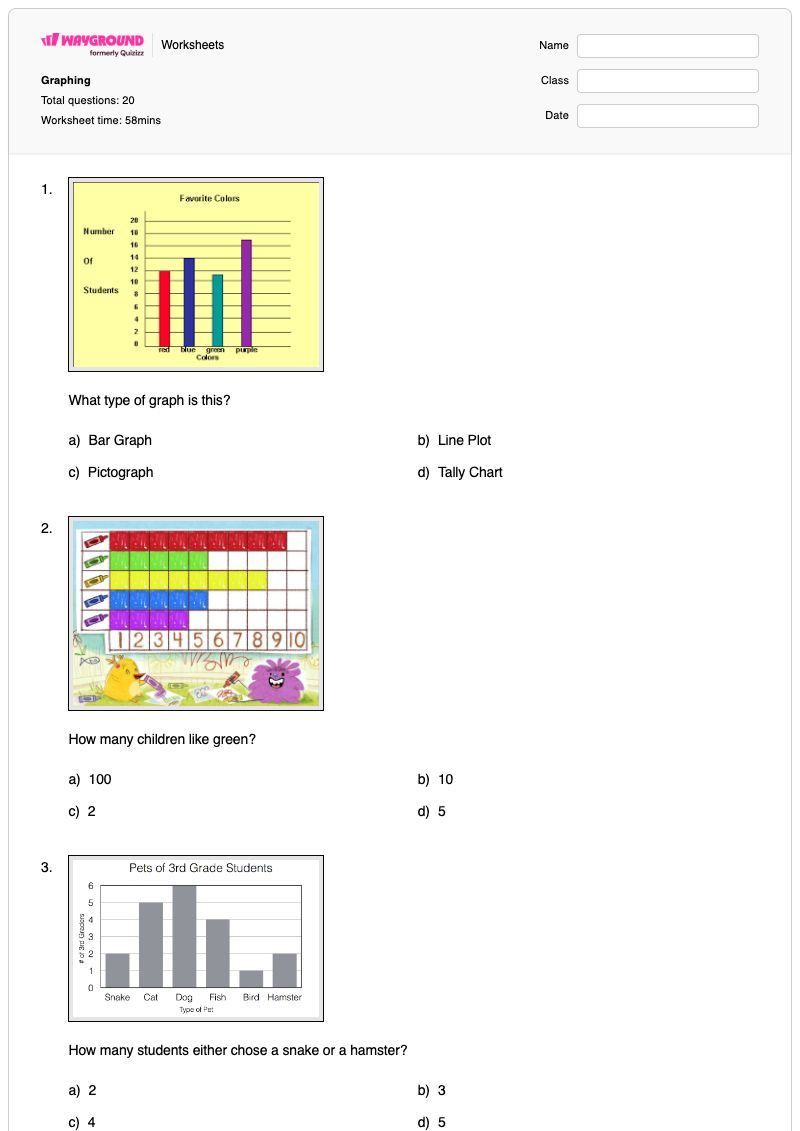
This Grade 4 mathematics worksheet gives students focused practice interpreting graphs and extracting information from data displays. The 20 multiple-choice questions ask students to identify graph types, read exact values, compare categories, find least and greatest amounts, combine data choices, and recognize patterns and changes over time. Students also interpret line-graph situations, including distance traveled, returning to a starting point, stopping, and slowing down.
The worksheet is designed for Grade 4 math instruction, independent practice, review, or a quick assessment of graph-reading skills. Its varied questions require students to use labels, scales, data points, and graph trends rather than simply recall definitions. This free printable worksheet includes a complete answer key, helping teachers check students’ understanding of reading and reasoning from graphs.
Worksheet settings
Font size
S
M
L
XL
Worksheets
Graphing
Total questions: 20
Name
Class
Date
1.
What type of graph is this?
a)
Bar Graph
b)
Line Plot
c)
Pictograph
d)
Tally Chart
2.
How many children like green?
a)
100
b)
10
c)
2
d)
5
3.
How many students either chose a snake or a hamster?
a)
2
b)
3
c)
4
d)
5
4.
Which sport is the least favorite?
a)
baseball
b)
football
c)
hockey
d)
basketball
5.
How many people liked Mickey Mouse best?
a)
4
b)
10
c)
5
d)
6
6.
How many students either chose basketball or football as their favorite sport?
a)
5
b)
8
c)
13
d)
14
7.
On what day of the week did the most shooting stars occur?
a)
Monday
b)
Wednesday
c)
Thursday
d)
Friday
8.
What pattern is evident on this line graph?
a)
Ability to do situps had no change as the days continued
b)
Ability to do situps decreased as the days continued
c)
Ability to do situps increased as the days continued
d)
Ability to do situps does not pertain to the graph
9.
People buy more drinks on ____ than any other day.
a)
Monday
b)
Tuesday
c)
Thursday
d)
Friday
10.
At 60 seconds, how far had this object traveled?
a)
0 m
b)
10 m
c)
20 m
d)
40 m
11.
How long did it take this object to travel back to its reference/starting point?
a)
20 s
b)
30 s
c)
60 s
d)
100 s
12.
How many times does this object STOP moving?
a)
None
b)
Once
c)
Twice
d)
Three times
13.
What is happening in this graph from point B to C?
a)
The object is going down a hill.
b)
The object is returning to its starting location.
c)
The object is slowing down.
d)
The object is staying still.
14.
How many pieces of candy were in the bag?
a)
4
b)
16
c)
19
d)
23
15.
Were there fewer lemon pieces or banana pieces?
a)
lemon
b)
banana
16.
What is the difference between Jill's 12th grade math score and her 7th grade math score?
a)
72
b)
91
c)
21
d)
19
17.
How many total people took the survey?
a)
50
b)
150
c)
100
d)
200
18.
Which graph matches the data?
a)
Graph 1
b)
Graph 2
c)
Graph 3
d)
Graph 4
19.
What is the name of this graph?
a)
line plot
b)
line graph
c)
bar graph
d)
frequency table
20.
At which age do the least amount of teens have a cell phone?
a)
18
b)
14
c)
13
d)
15
Answer Key
Graphing
Total questions: 20
1.
a) Bar Graph
2.
d) 5
3.
c) 4
4.
c) hockey
5.
c) 5
6.
c) 13
7.
c) Thursday
8.
c) Ability to do situps increased as the days continued
9.
d) Friday
10.
d) 40 m
11.
d) 100 s
12.
b) Once
13.
c) The object is slowing down.
14.
d) 23
15.
b) banana
16.
d) 19
17.
c) 100
18.
c) Graph 3
19.
b) line graph
20.
c) 13
140 %
Browse by subjects
Browse by grades
Browse by format
FAQs
What does this Grade 4 graphing worksheet cover?
This worksheet builds graph interpretation skills through 20 multiple-choice questions. Students identify graph types, read values from data displays, compare categories, combine counts, determine least and greatest amounts, and interpret line-graph trends such as increasing movement, stopping, slowing down, and returning to a starting point.
How can I use this worksheet to teach students to interpret graphs?
Introduce the worksheet by modeling how to read a graph’s title, labels, scale, categories, and plotted data before students answer independently. For questions about favorite sports, foods, or characters, ask students to point to the values that support their comparisons; for the motion-graph items, have them explain what each segment shows about distance or movement over time.
What mistakes should I watch for when students complete this graphing worksheet?
Students may confuse the graph type, overlook the scale, or select a nearby category instead of reading the exact value. Watch for errors when students add two categories in “either/or” questions, identify the least amount, or interpret a motion graph: a flat section indicates stopping, while a changing segment can show slowing down or movement back toward the starting point.
How do I assign and grade this graphing worksheet?
The worksheet is available as a printable PDF and as a digital quiz on Wayground, and it includes a complete answer key for all 20 multiple-choice questions. For printable submissions, you can scan student work with the Wayground for Teachers app to grade it efficiently.
How can I differentiate this graph-reading worksheet for my students?
Use the worksheet’s Advanced Settings to adjust font spacing or choose a larger font size so graph questions, labels, and answer choices are easier to follow. You can also enable a dyslexia-friendly font or translate the worksheet into another language when those options support access to the graph-reading tasks.
Where can I find more worksheets like this on Wayground?
Wayground offers a broad collection of free printable worksheets and practice problems across subjects, with downloadable PDFs and answer keys to support mastery of essential skills and concepts. Browse more resources at https://wayground.com/en-us/worksheets.


 Worksheets





